Results of the GECCO'2017 1-OBJ expensive Track
"Raw" Result Data
On each problem participants were judged by the best (lowest) function value achieved within the given budget of function evaluations. There were 13 participants in the field. The best function value per problem and participant (1000 times 13 double precision numbers) is listed in this text file.
Participant Ranking
Participants were ranked based on aggregated problem-wise ranks (details here and here). The following results table lists participants with overall scores (higher is better) and the sum of ranks over all problems (lower is better) The table can be sorted w.r.t. these criteria.
| rank | participant | method name | method description | software | paper | score  |
sum of ranks  |
|
|---|---|---|---|---|---|---|---|---|
| 1 | LB | DTS-CMA-ES or BOBYQA | Doubly trained surrogate CMA-ES (DTS-CMA-ES) with 5% of the number of original-evaluated points per generation, or Powell's BOBYQA (Dlib C++ re-implementation) if evaluations budget is less than 15D. | 824.715 | 4733 | |||
| 2 | Simon Wessing | RLMBO+LBFGSB+RS | Restarted local model-based optimization (alpha version), L-BFGS-B, and random search | link | 691.064 | 5562 | ||
| 3 | Artelys | Artelys Knitro | Artelys Knitro used in derivative-free mode with multistart | link | link | 593.055 | 6482 | |
| 4 | Al Jimenez | 575.891 | 5386 | |||||
| 5 | bujok | IDEbdQ |
|
496.176 | 5728 | |||
| 6 | SACOBRA | SACOBRA | Self-adjusting Constrained Optimization with RBF and online model selection. (Due to time shortage and computational time limits only less than 85% of the problems were addressed completely) | 468.327 | 5884 | |||
| 7 | EMAGIN's Tomcat | Emagin's Tomcat (Sparrow mode) - Developed by Mohammadamin Jahanpour | 433.147 | 6218 | ||||
| 8 | Giacomo Nannicini | 333.639 | 6496 | |||||
| 9 | Poly Montreal | 208.556 | 7857 | |||||
| 10 | Jeremy M | Custom algorithm | 198.68 | 8602 | ||||
| 11 | Ralf S. | Mix of PSO and GA | 170.237 | 8045 | ||||
| 12 | djagodzi | DES - Differential Evolution Strategy | 76.1887 | 9431 | ||||
| 13 | jarabas | CMADE - Covariance Matrix Adaptation Differential Evolution | 33.1138 | 10561 |
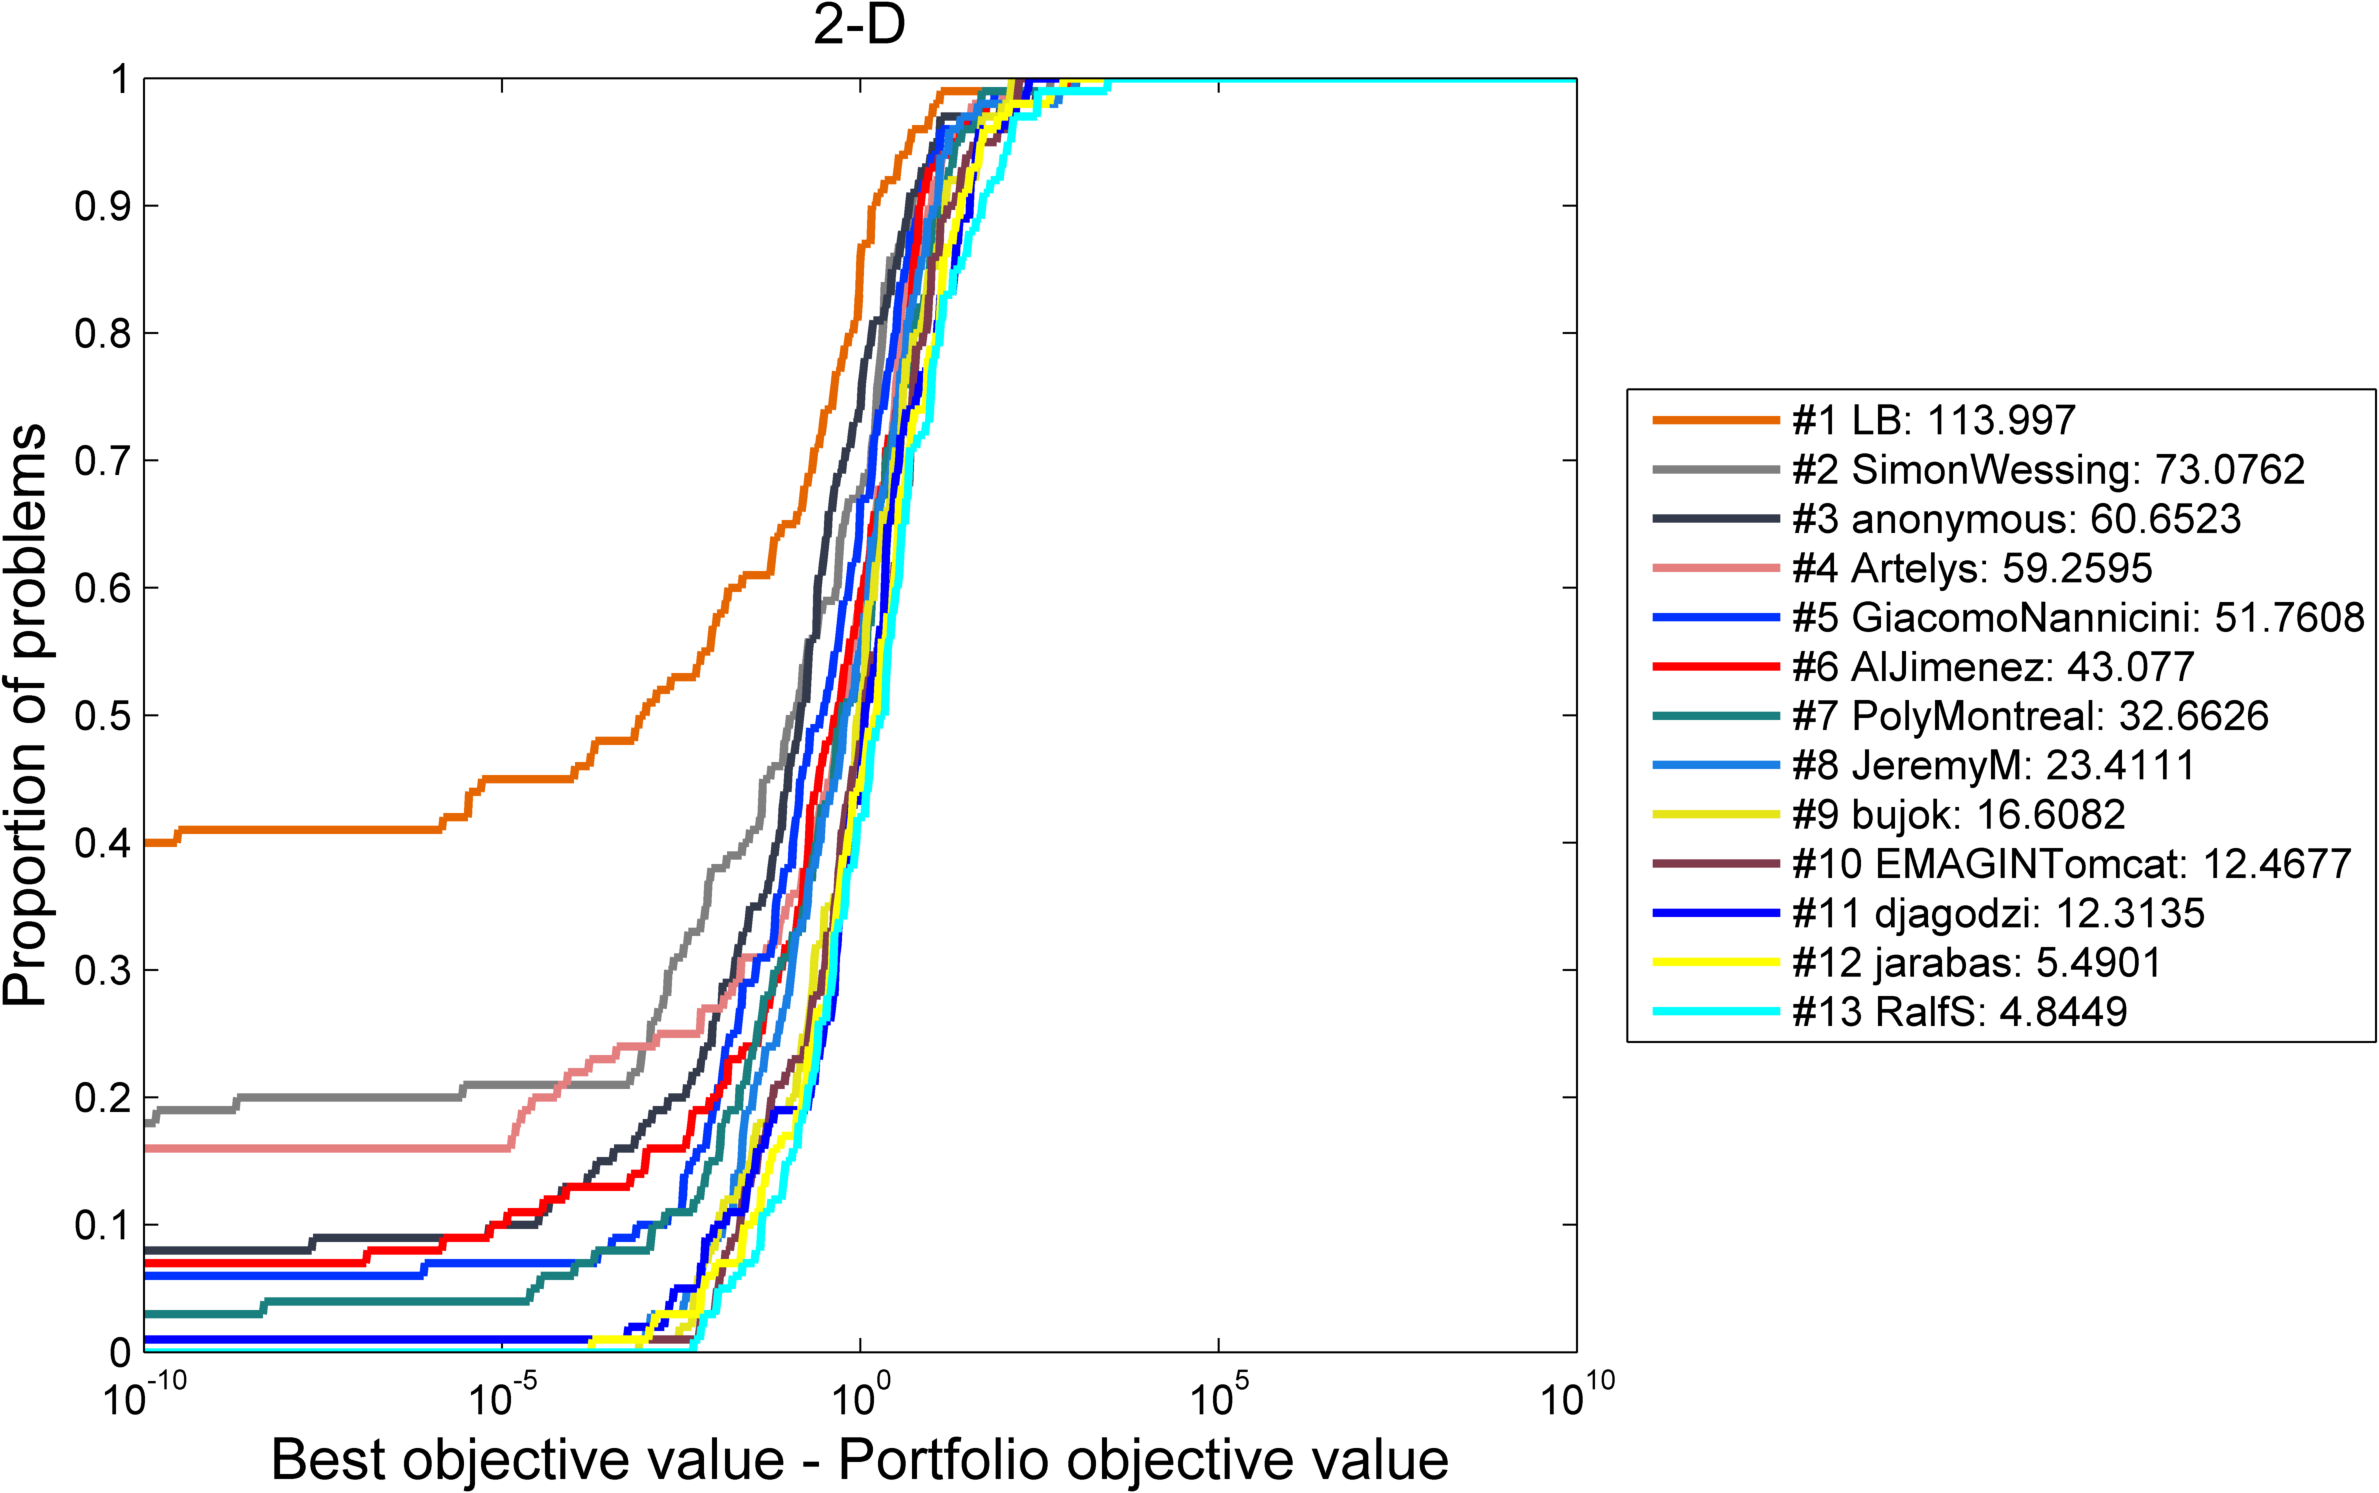
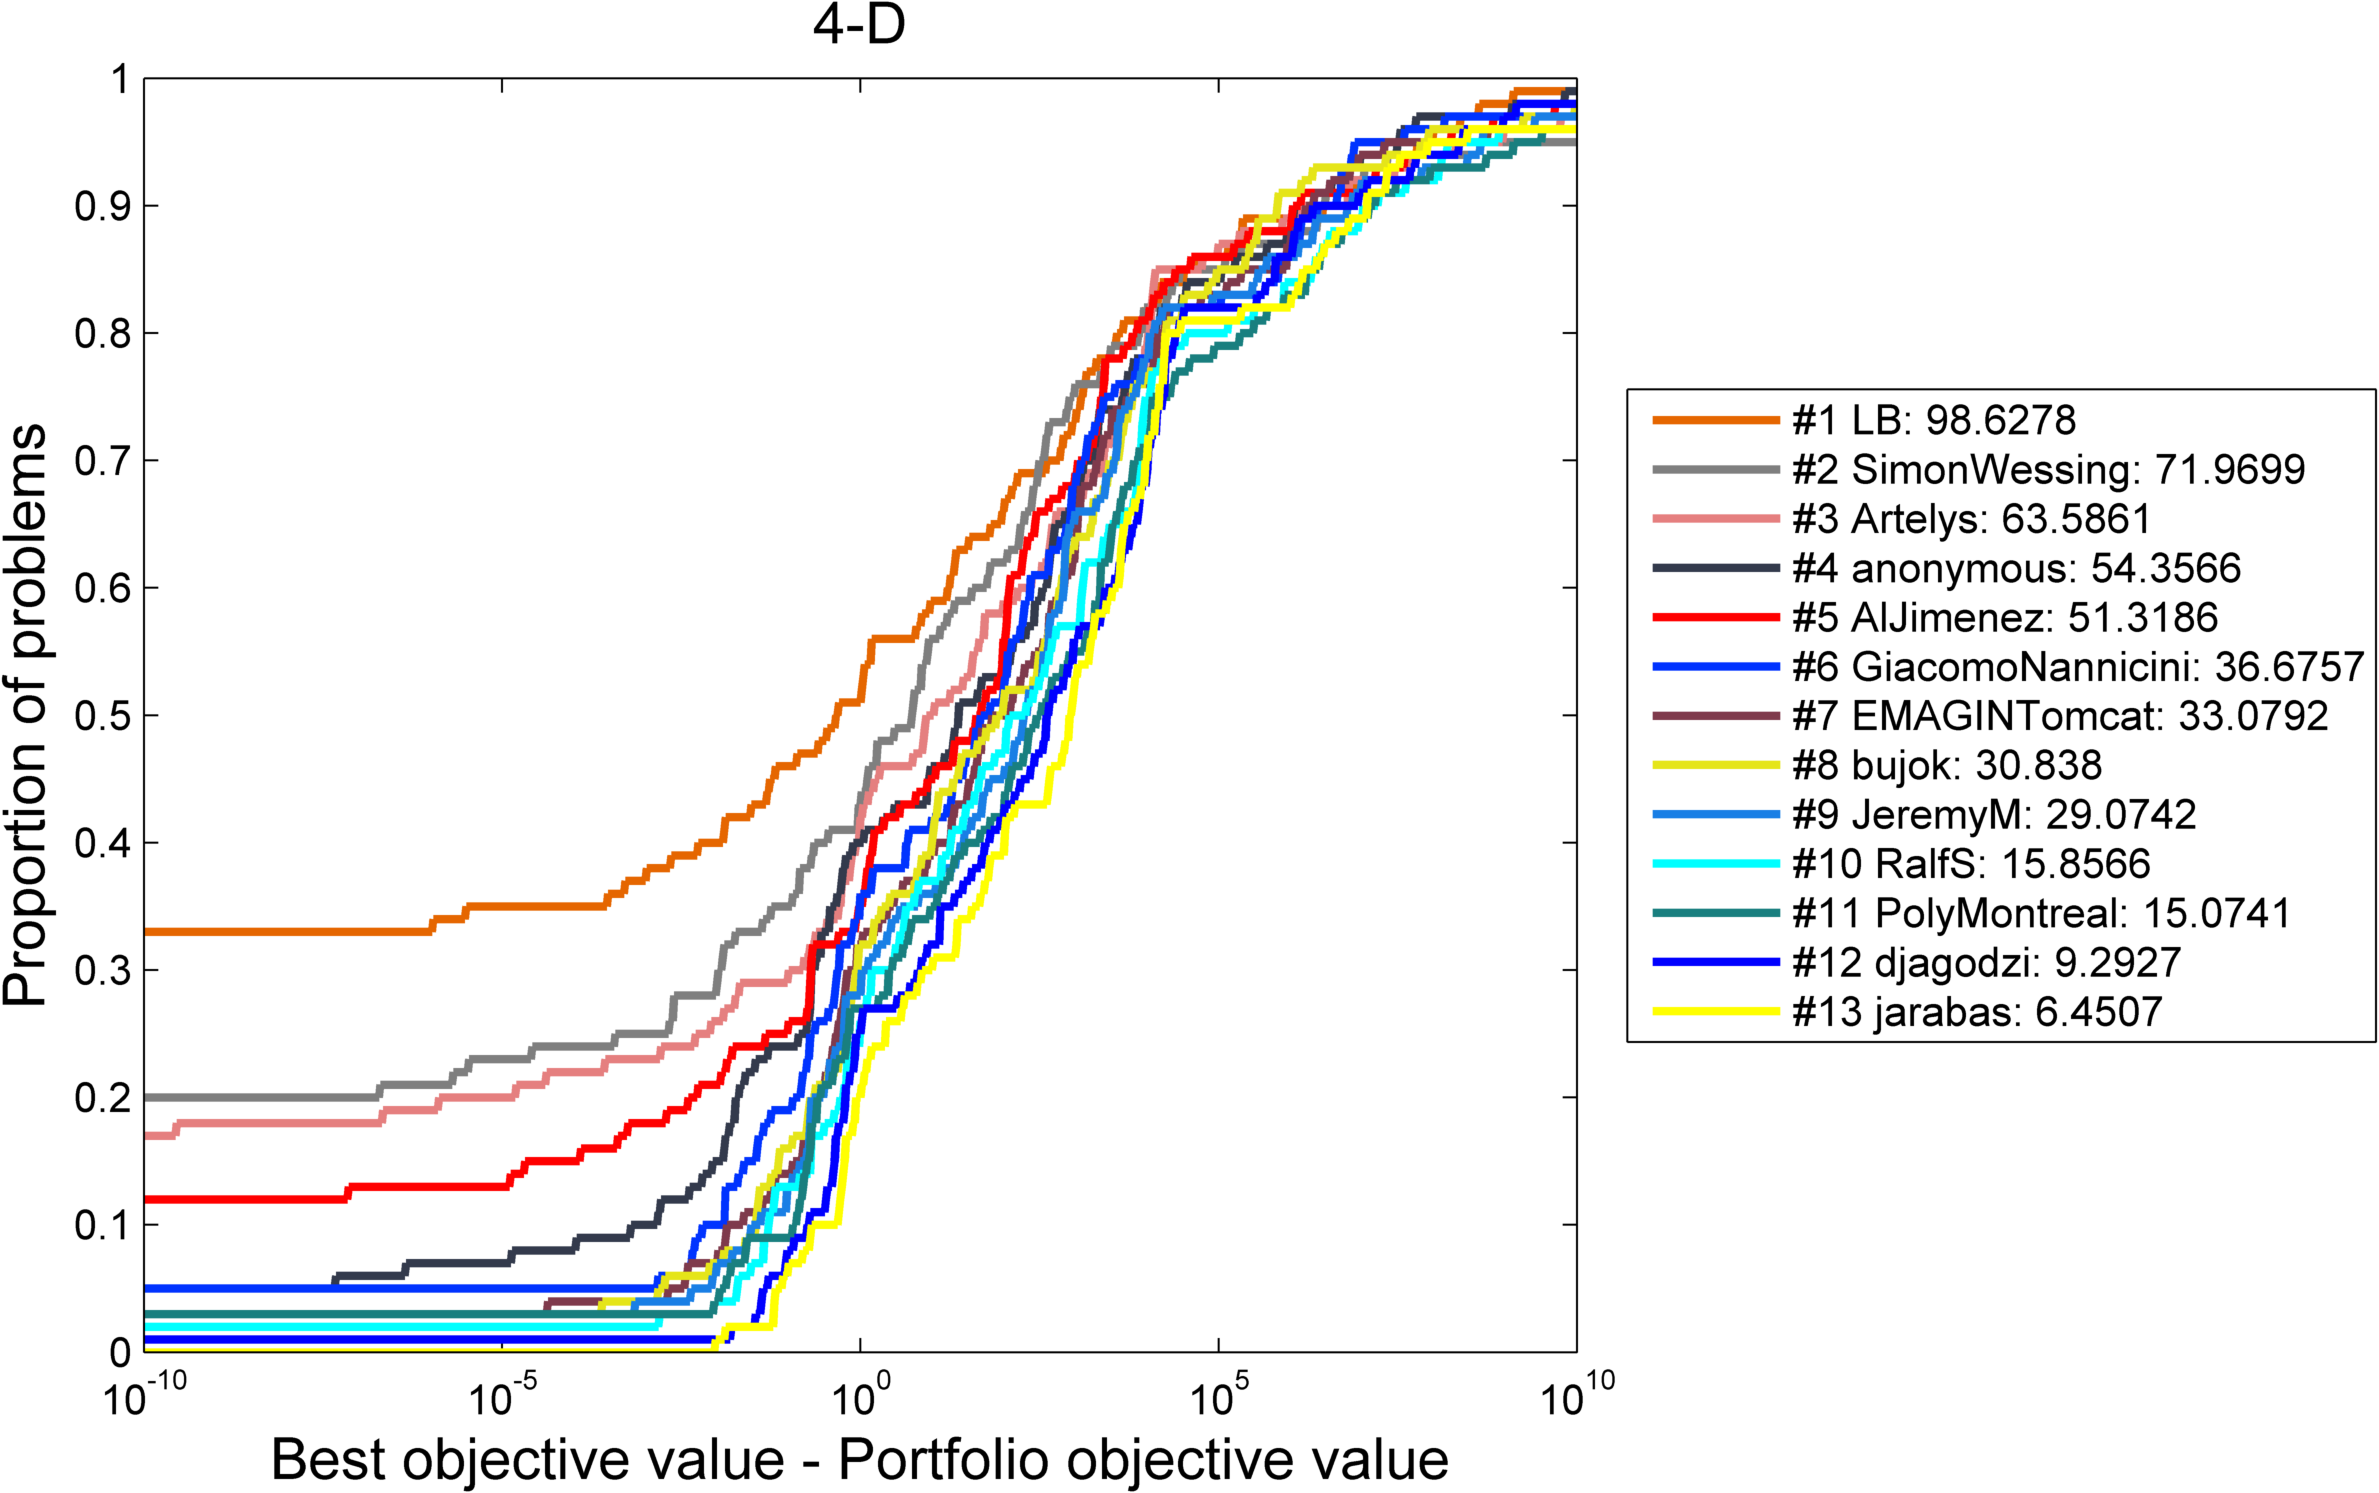
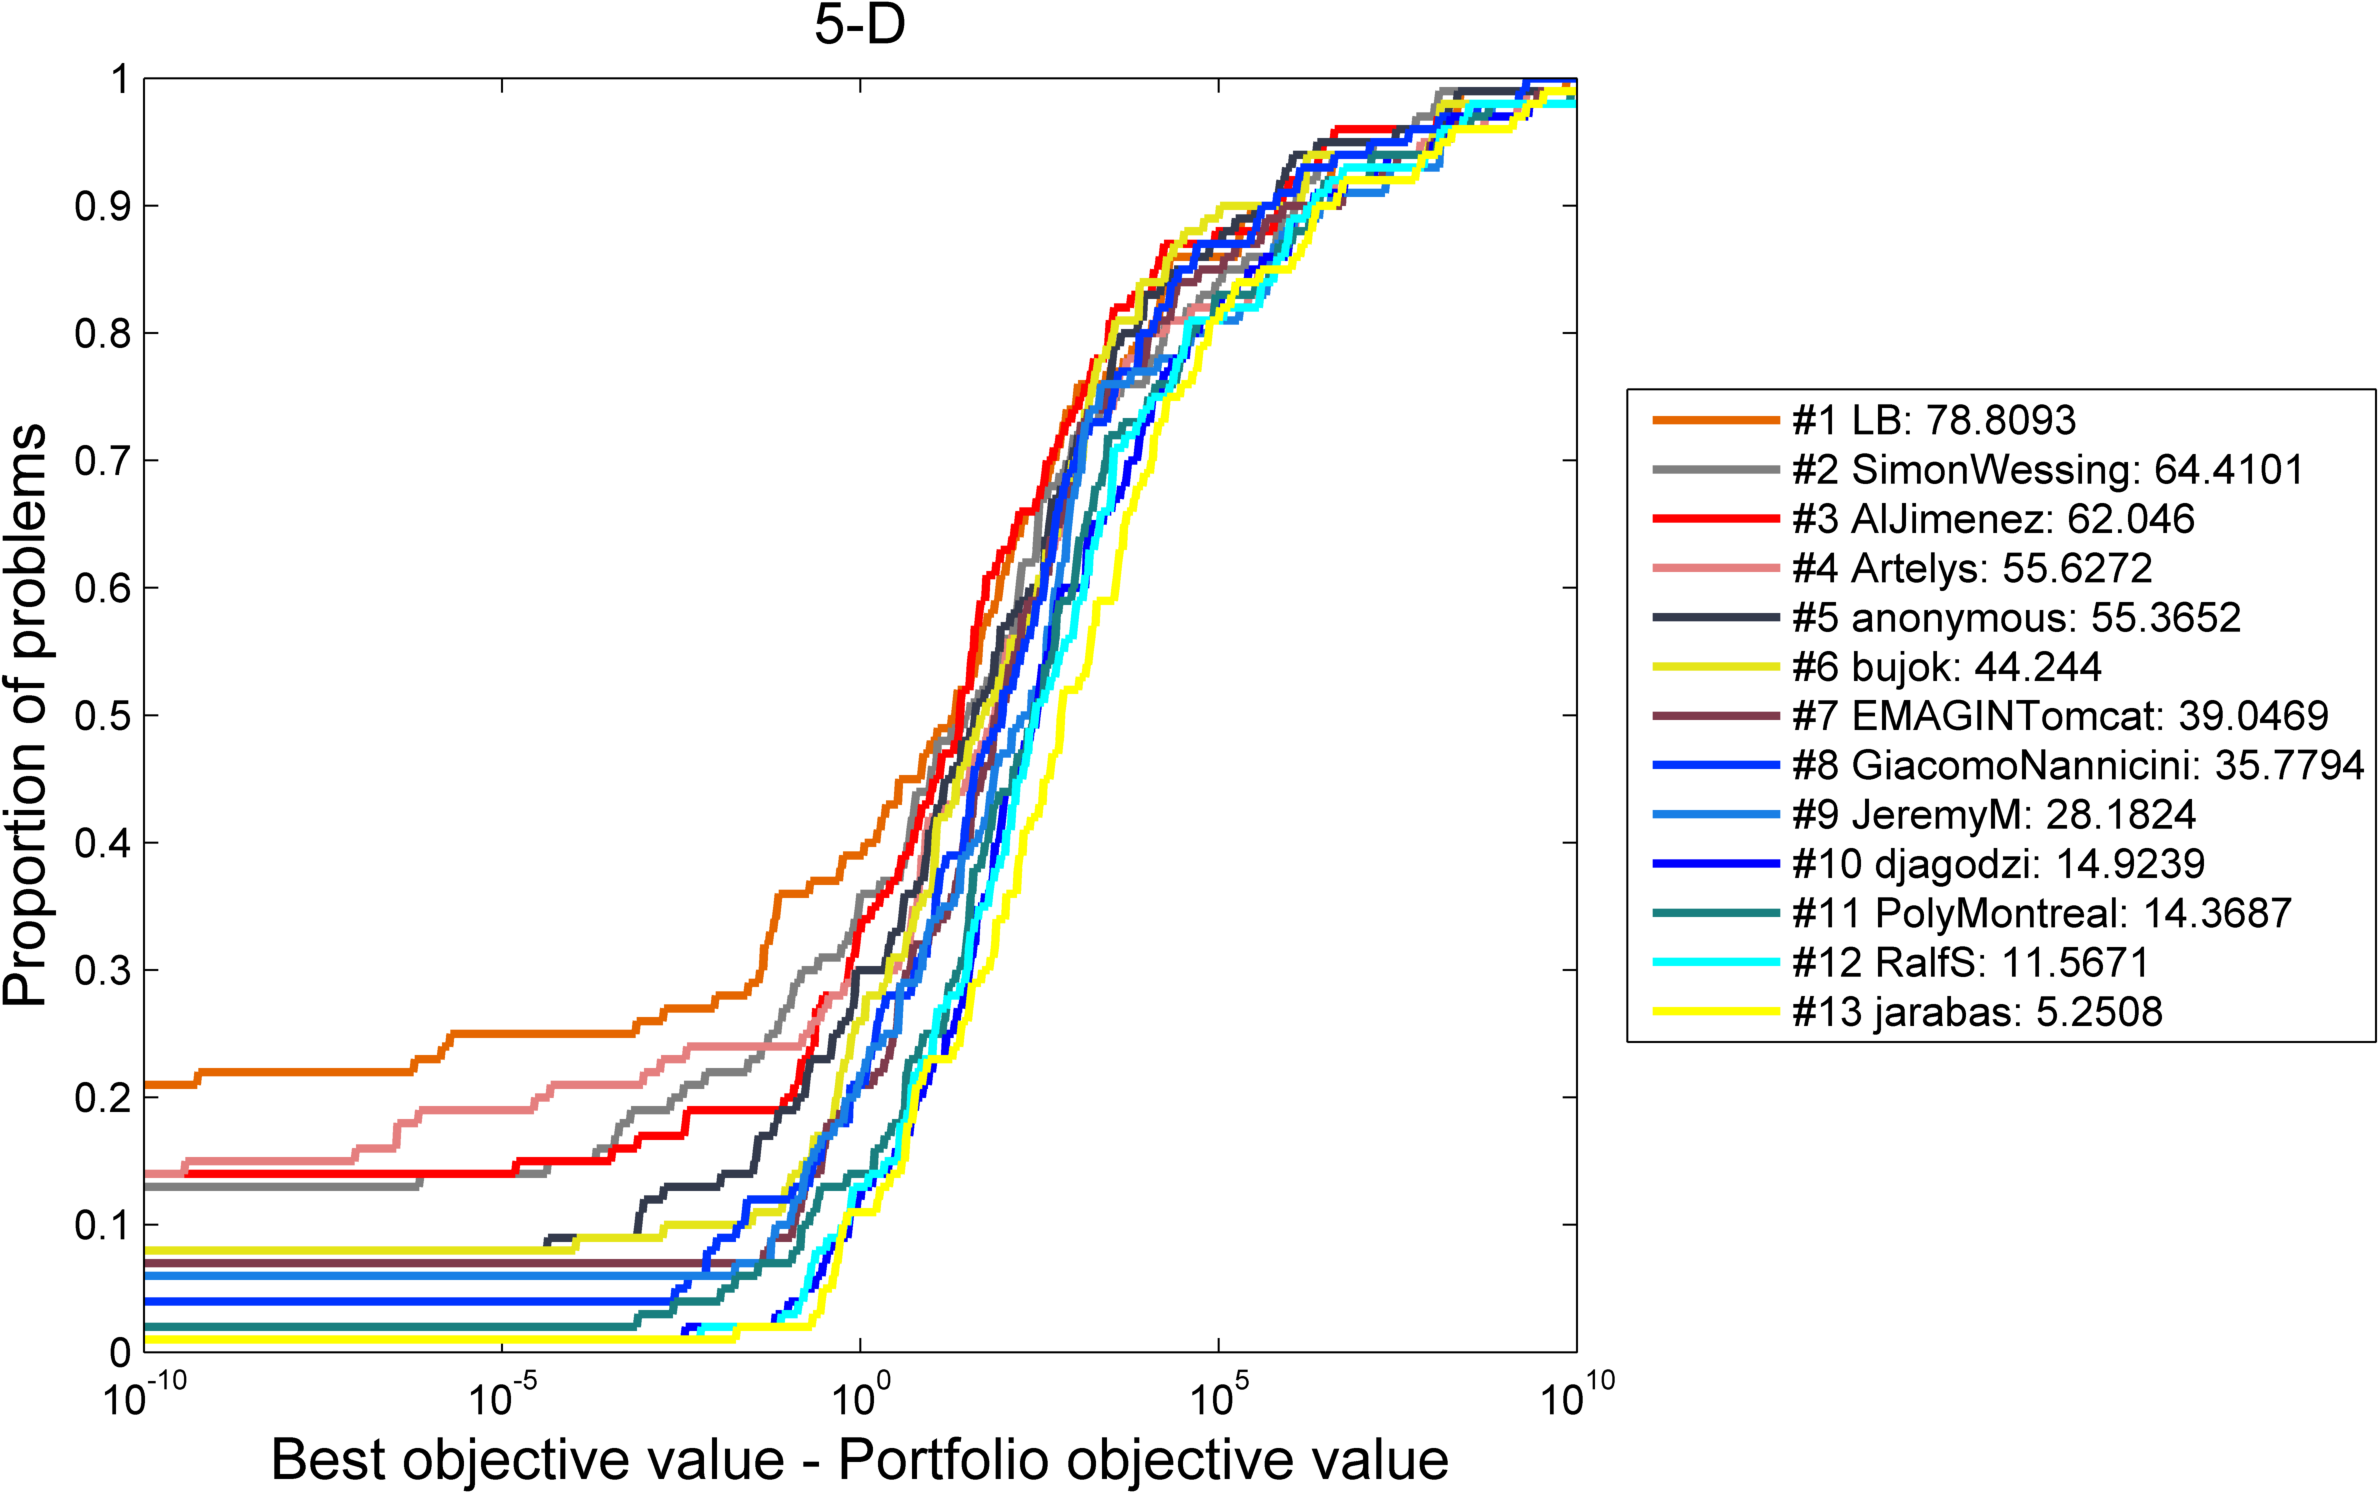
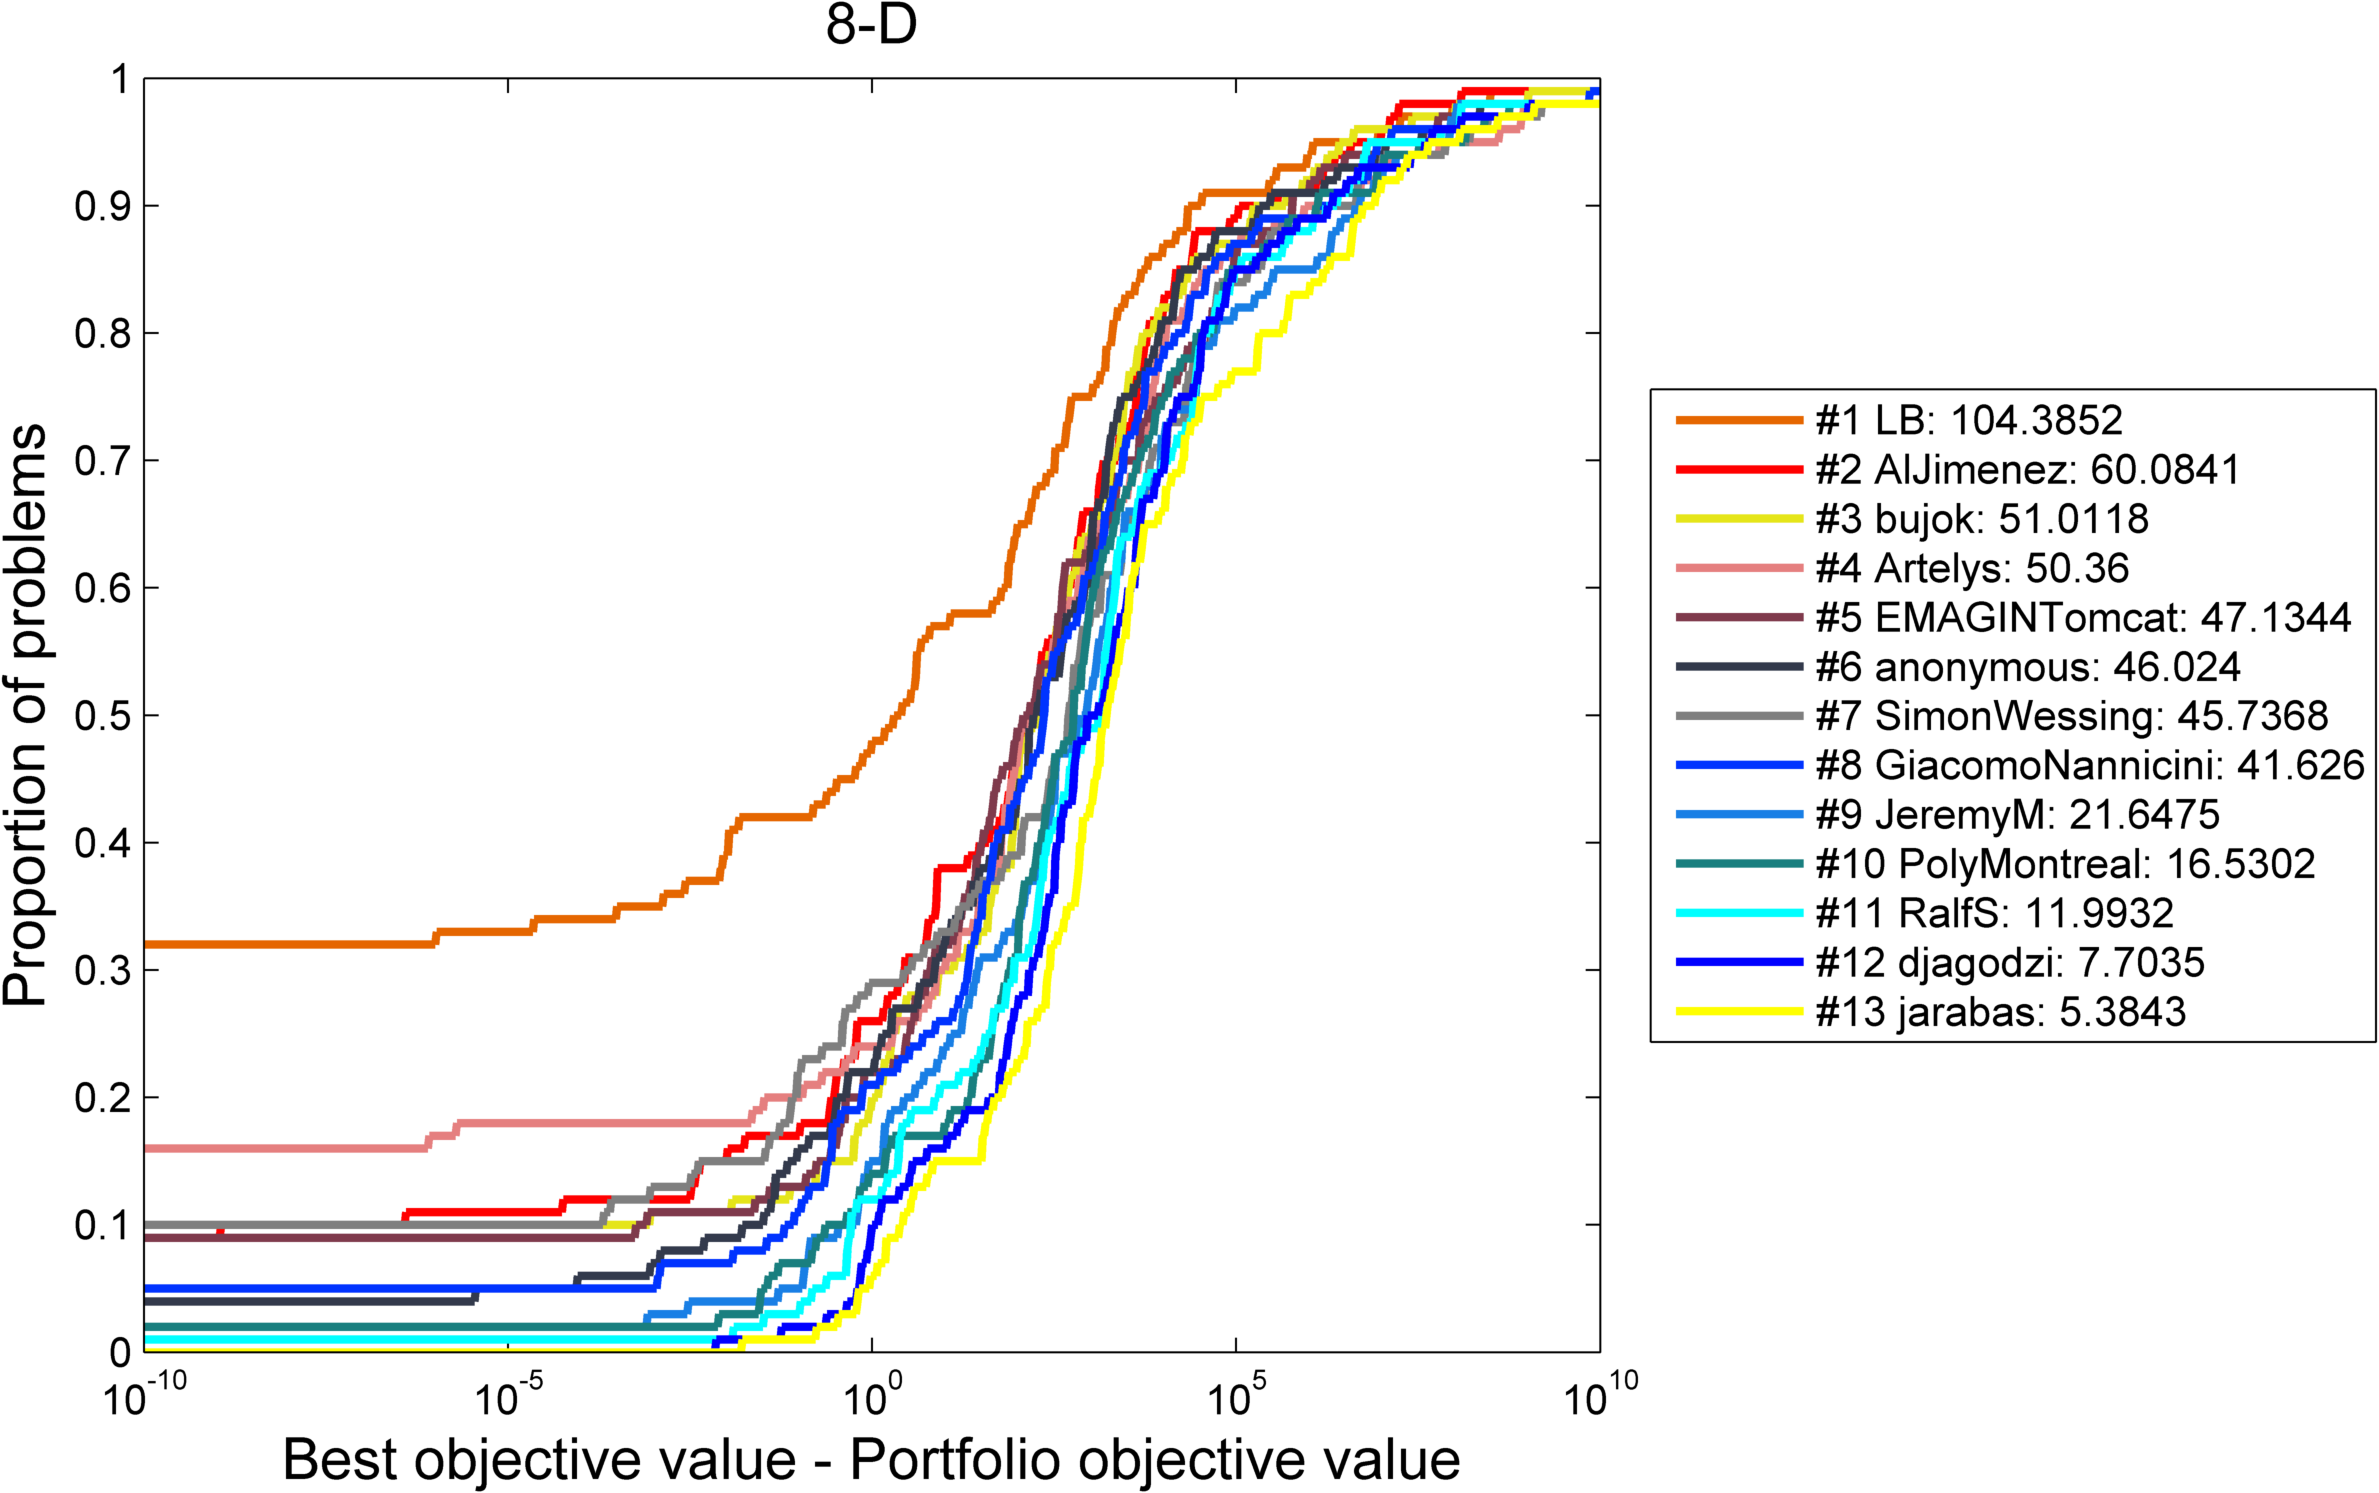
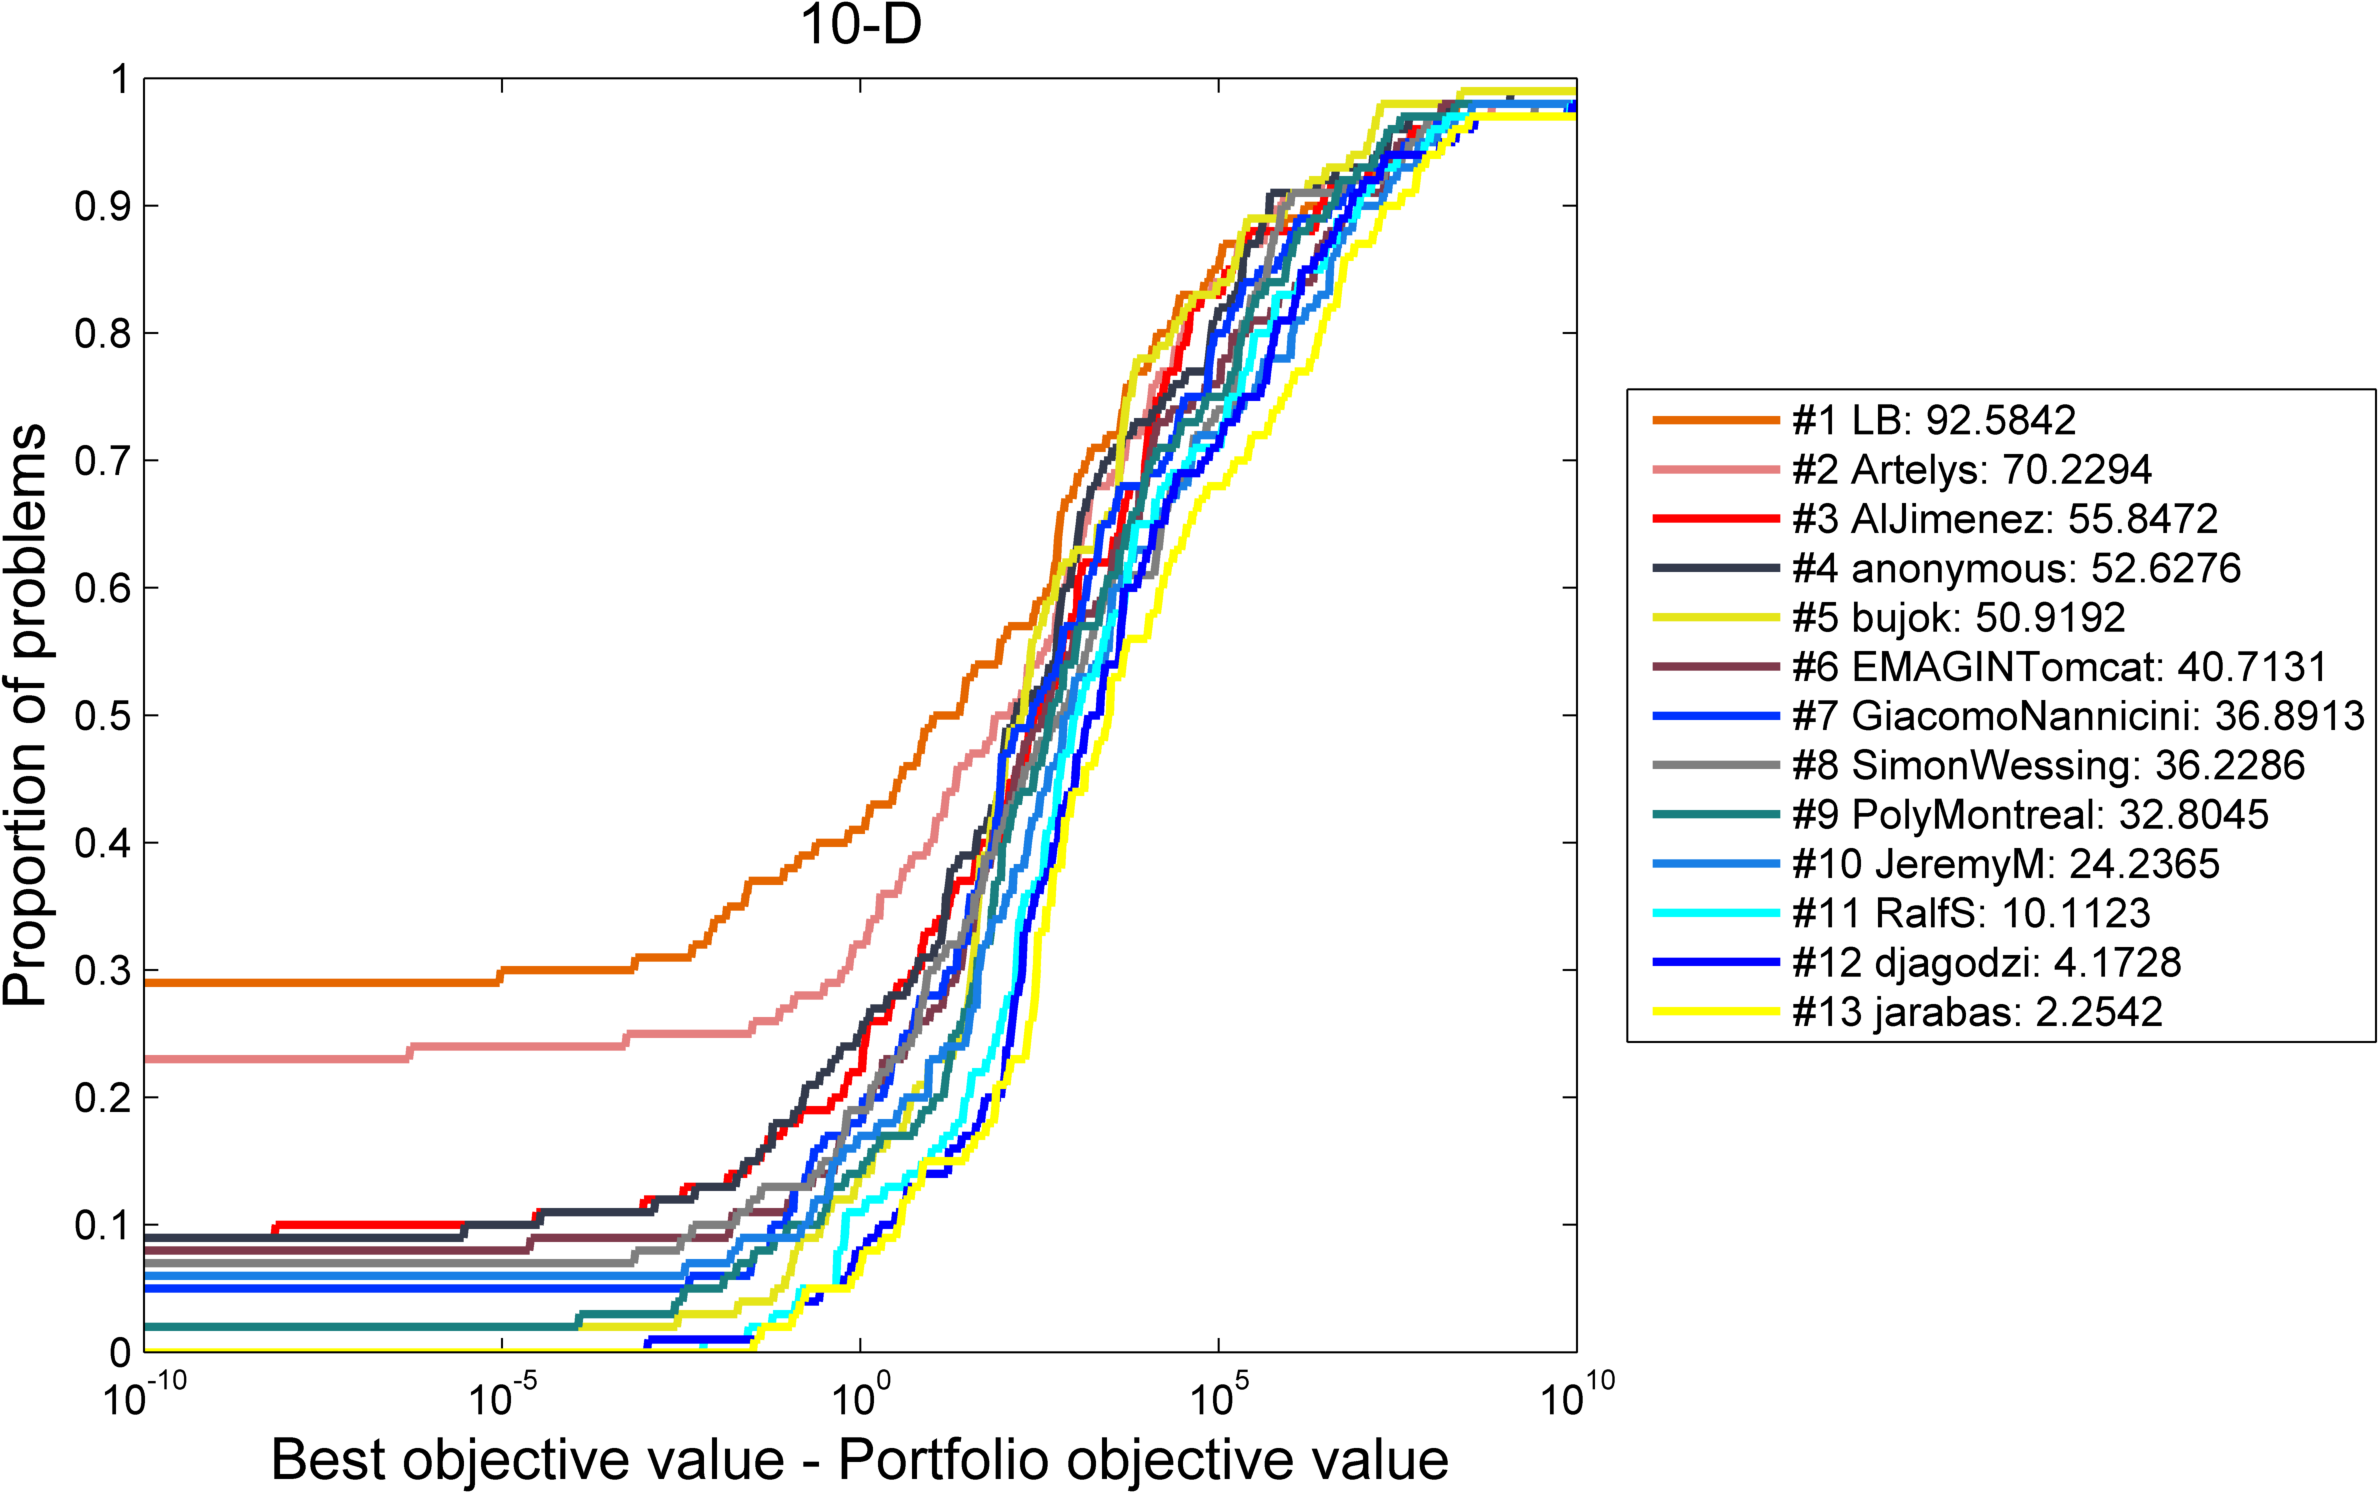
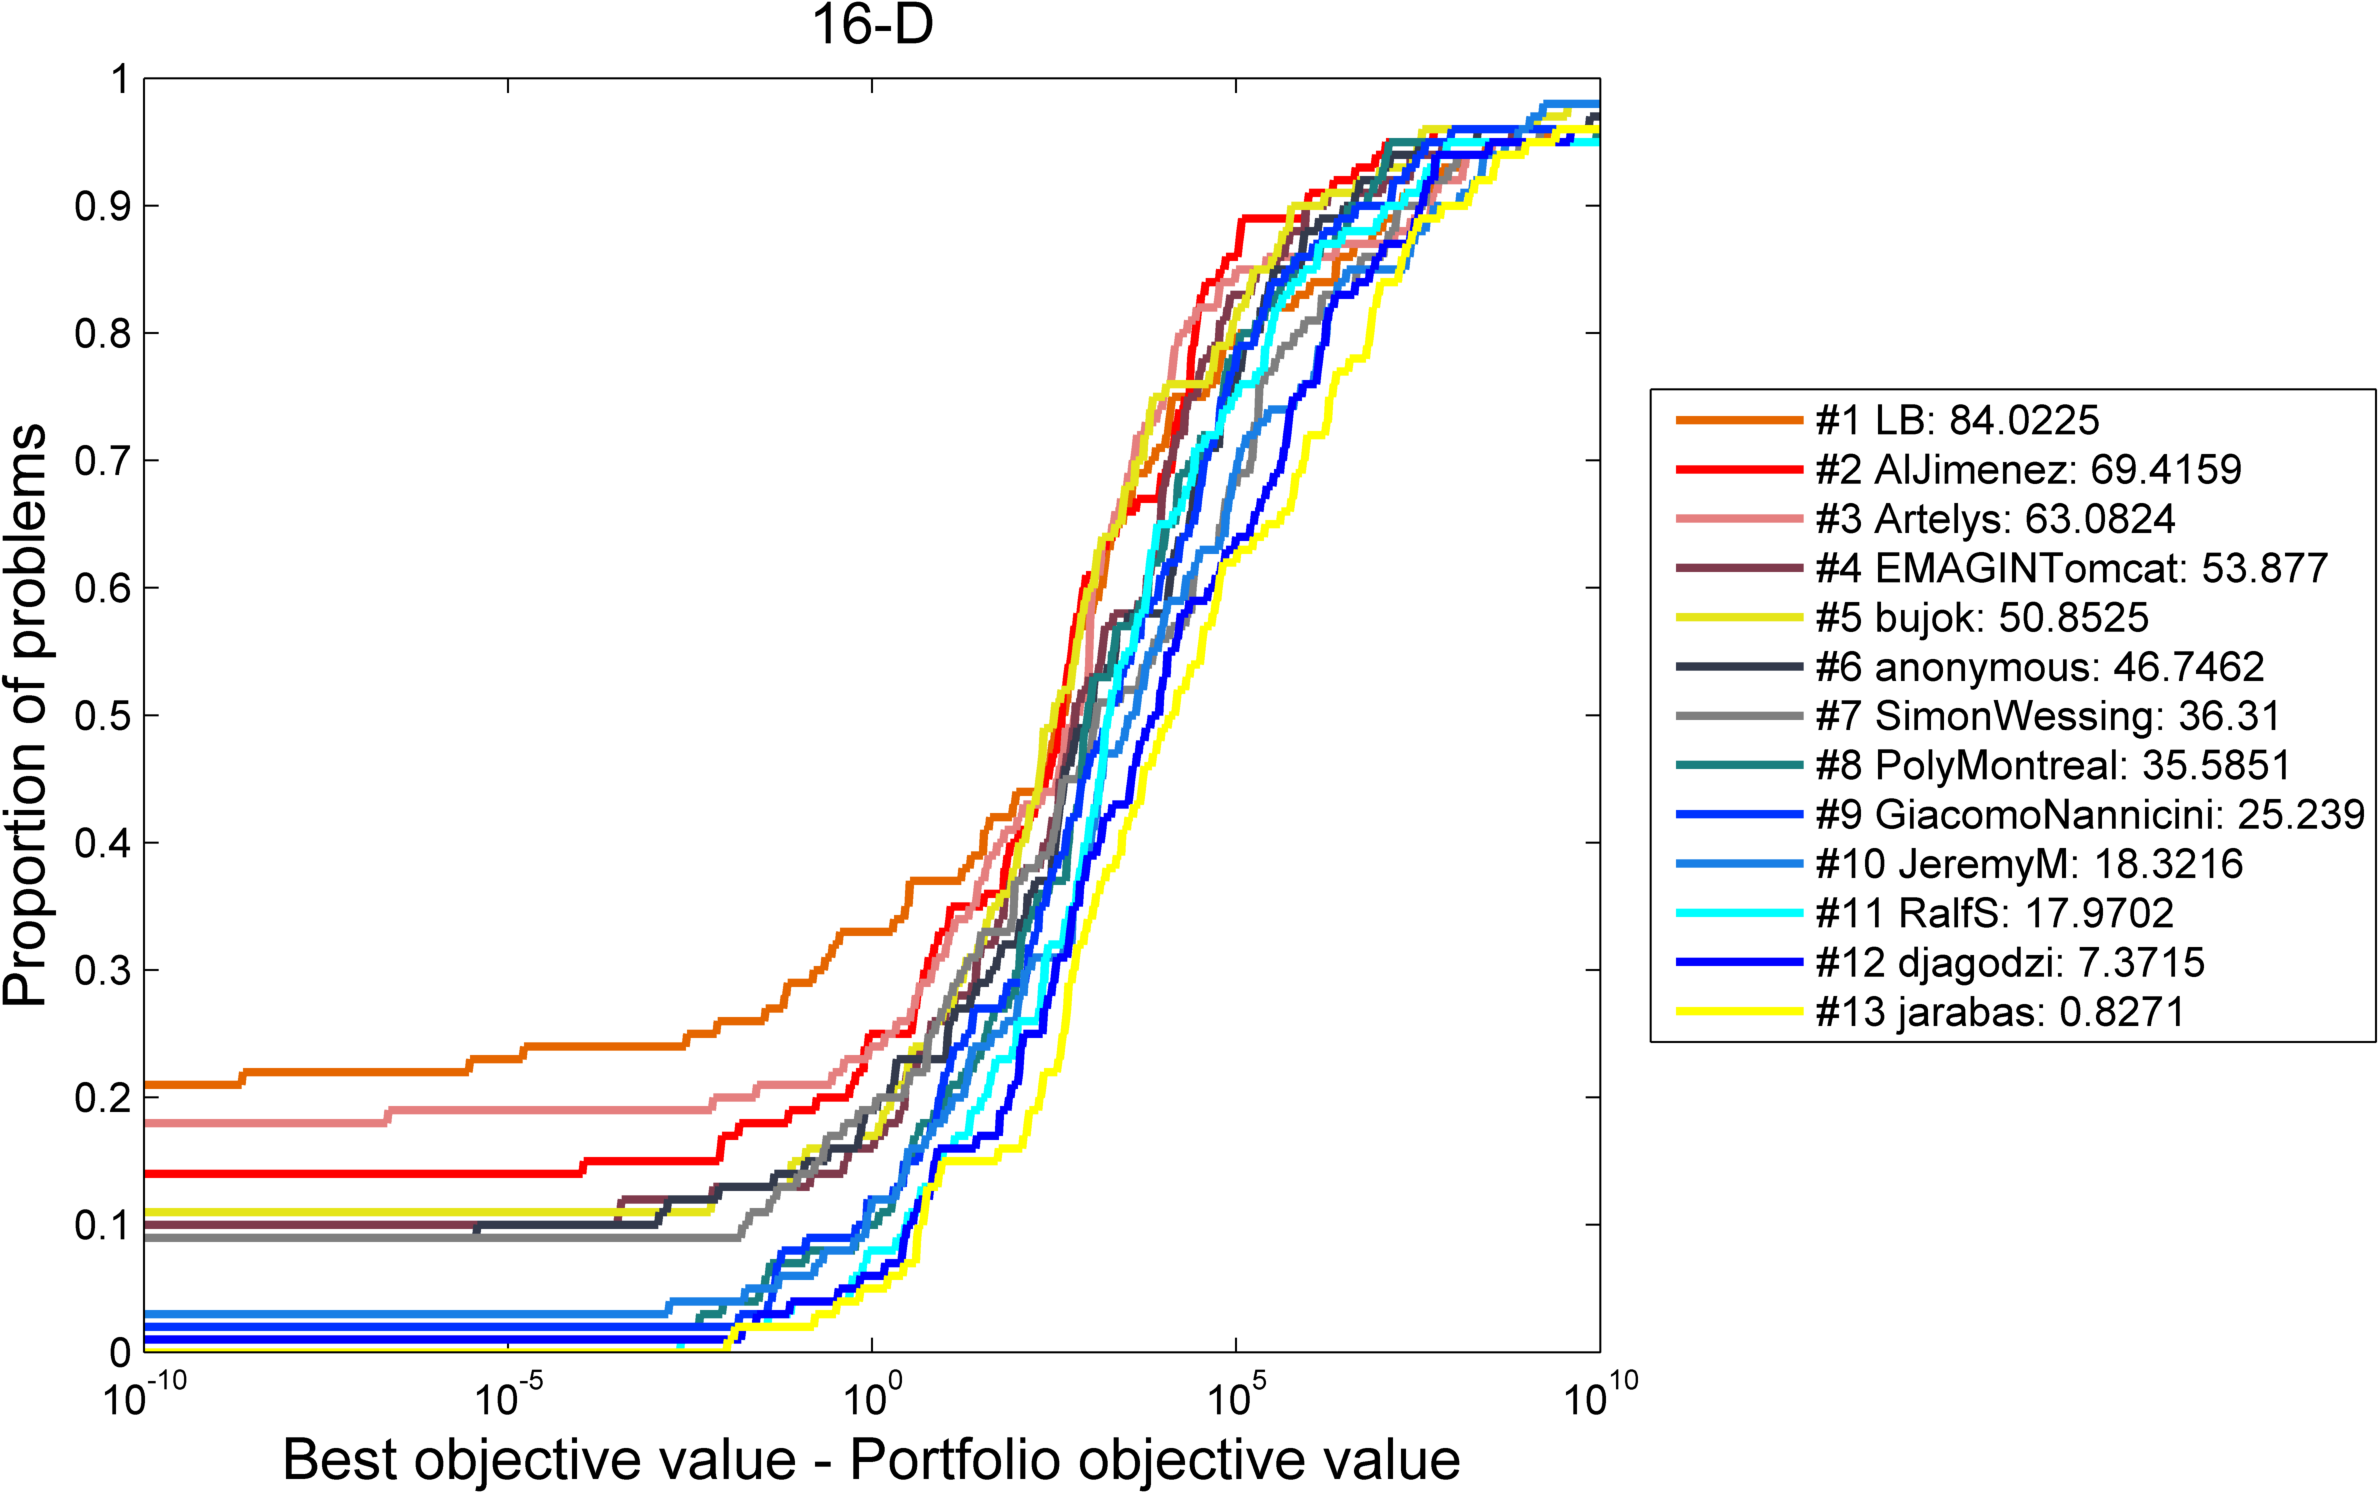
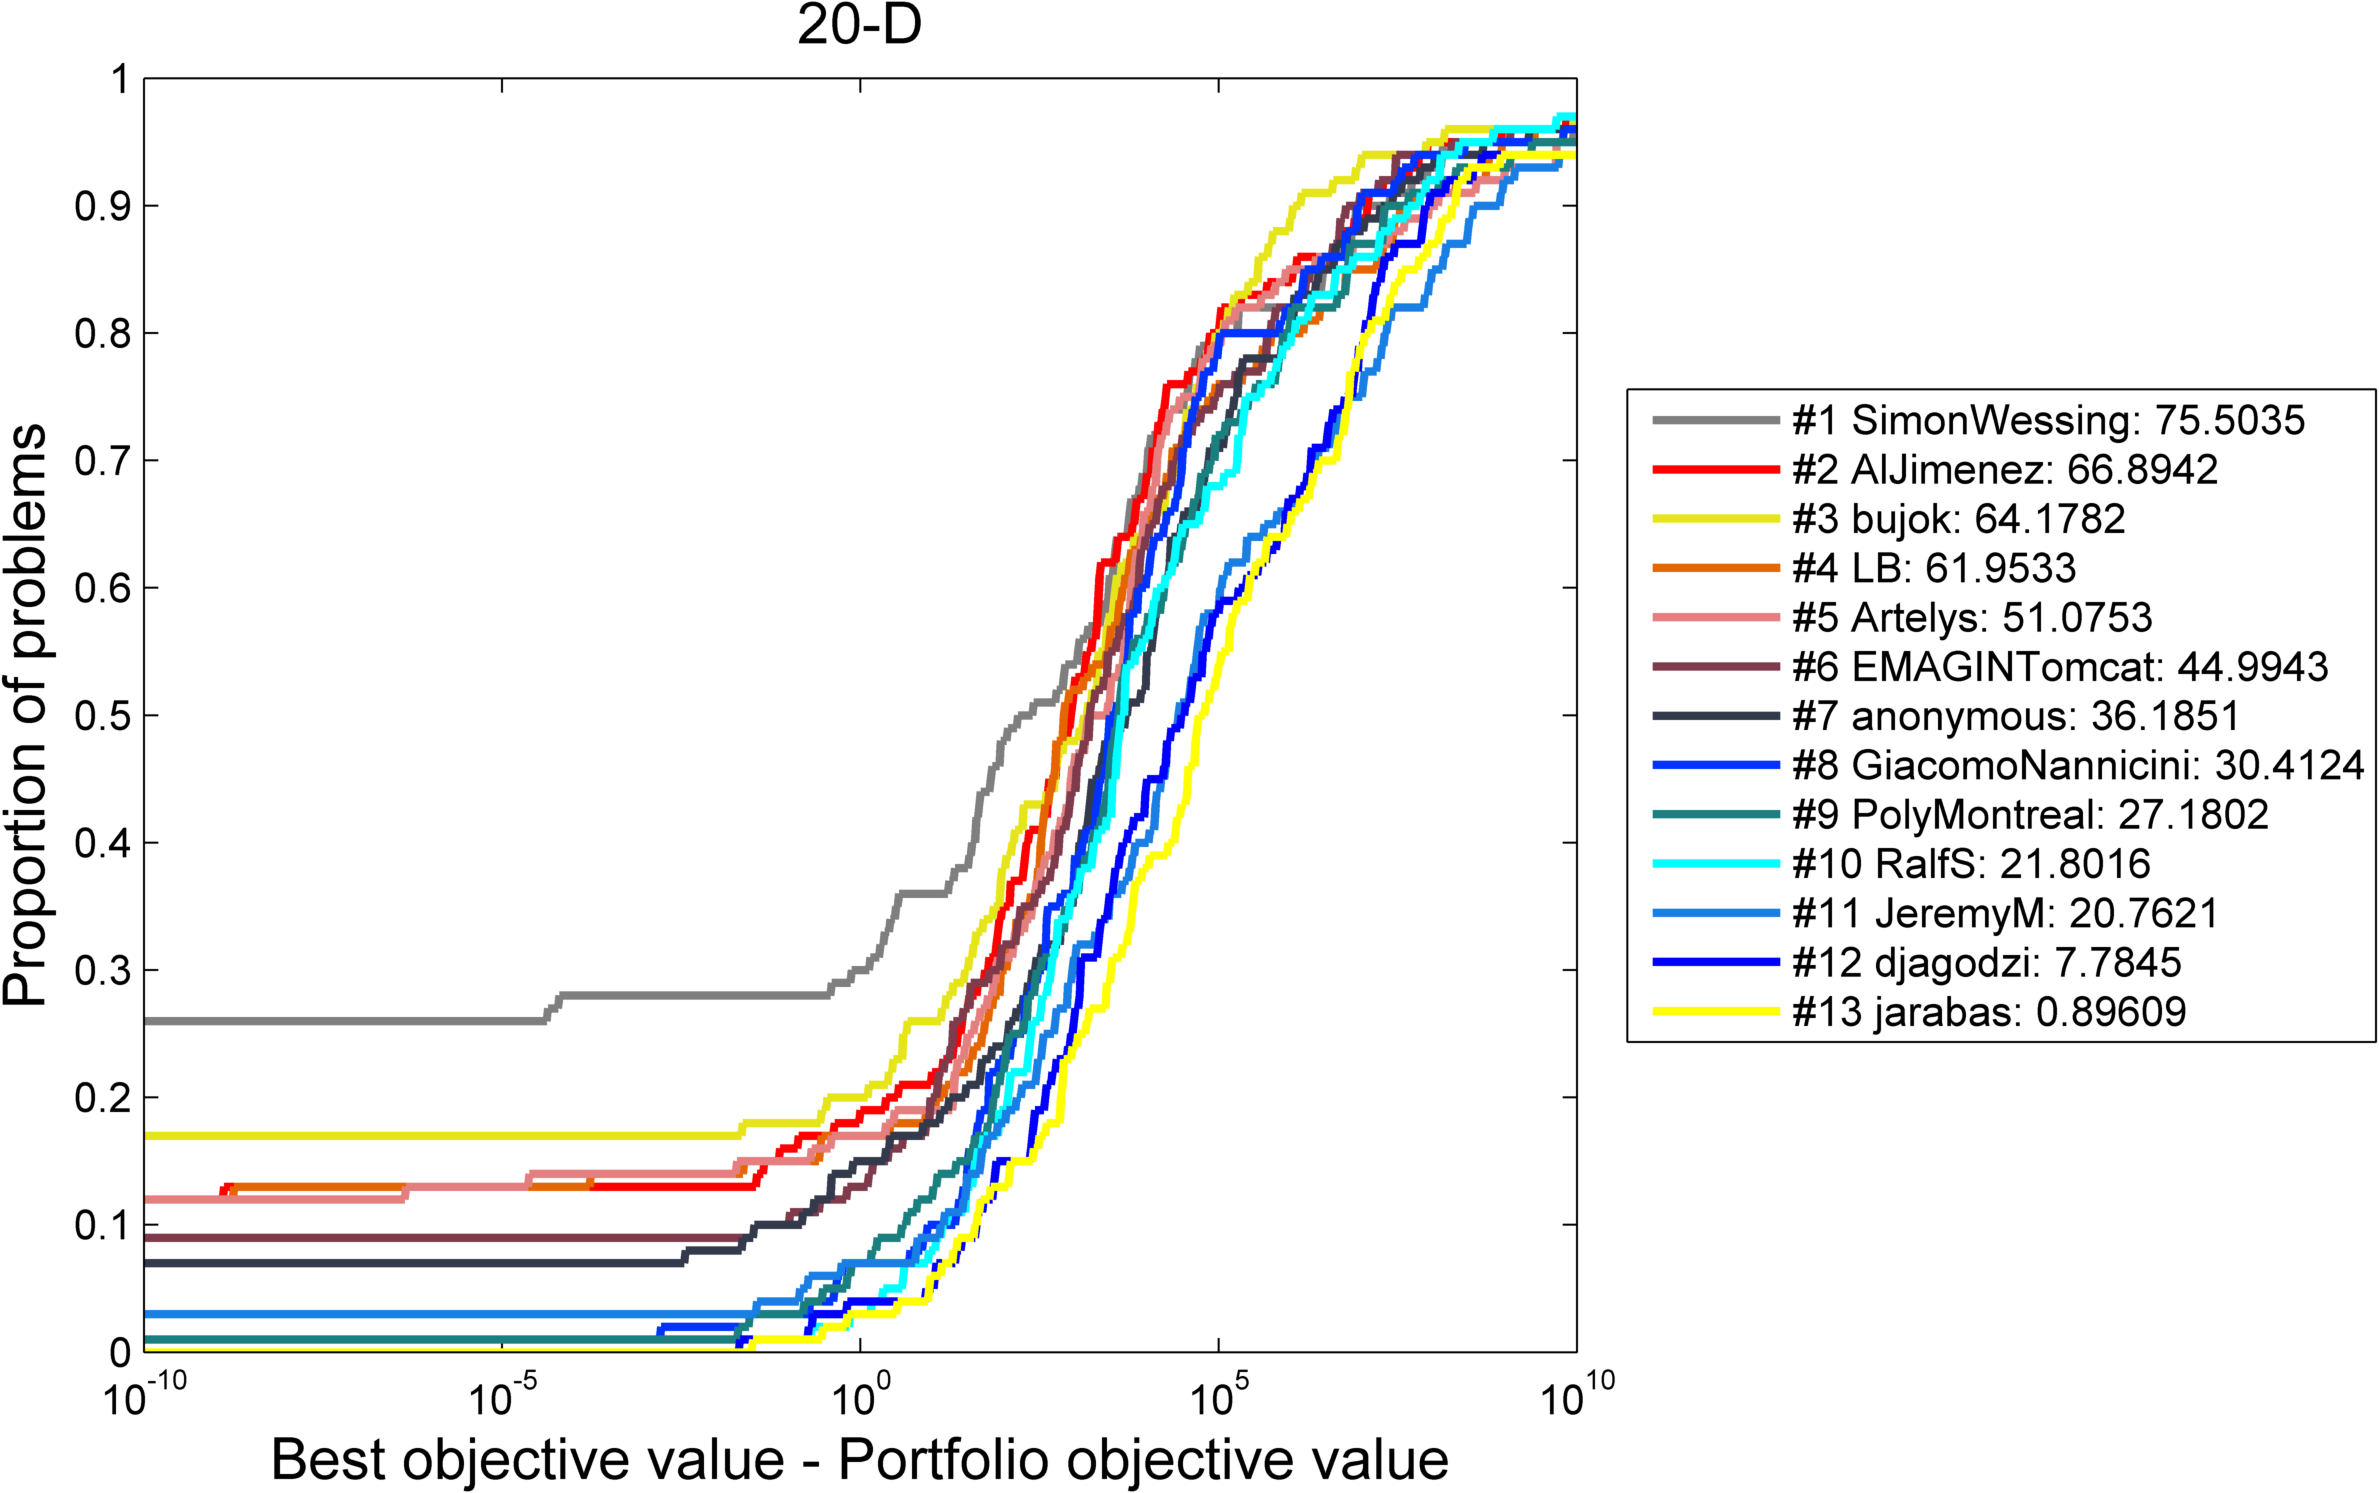
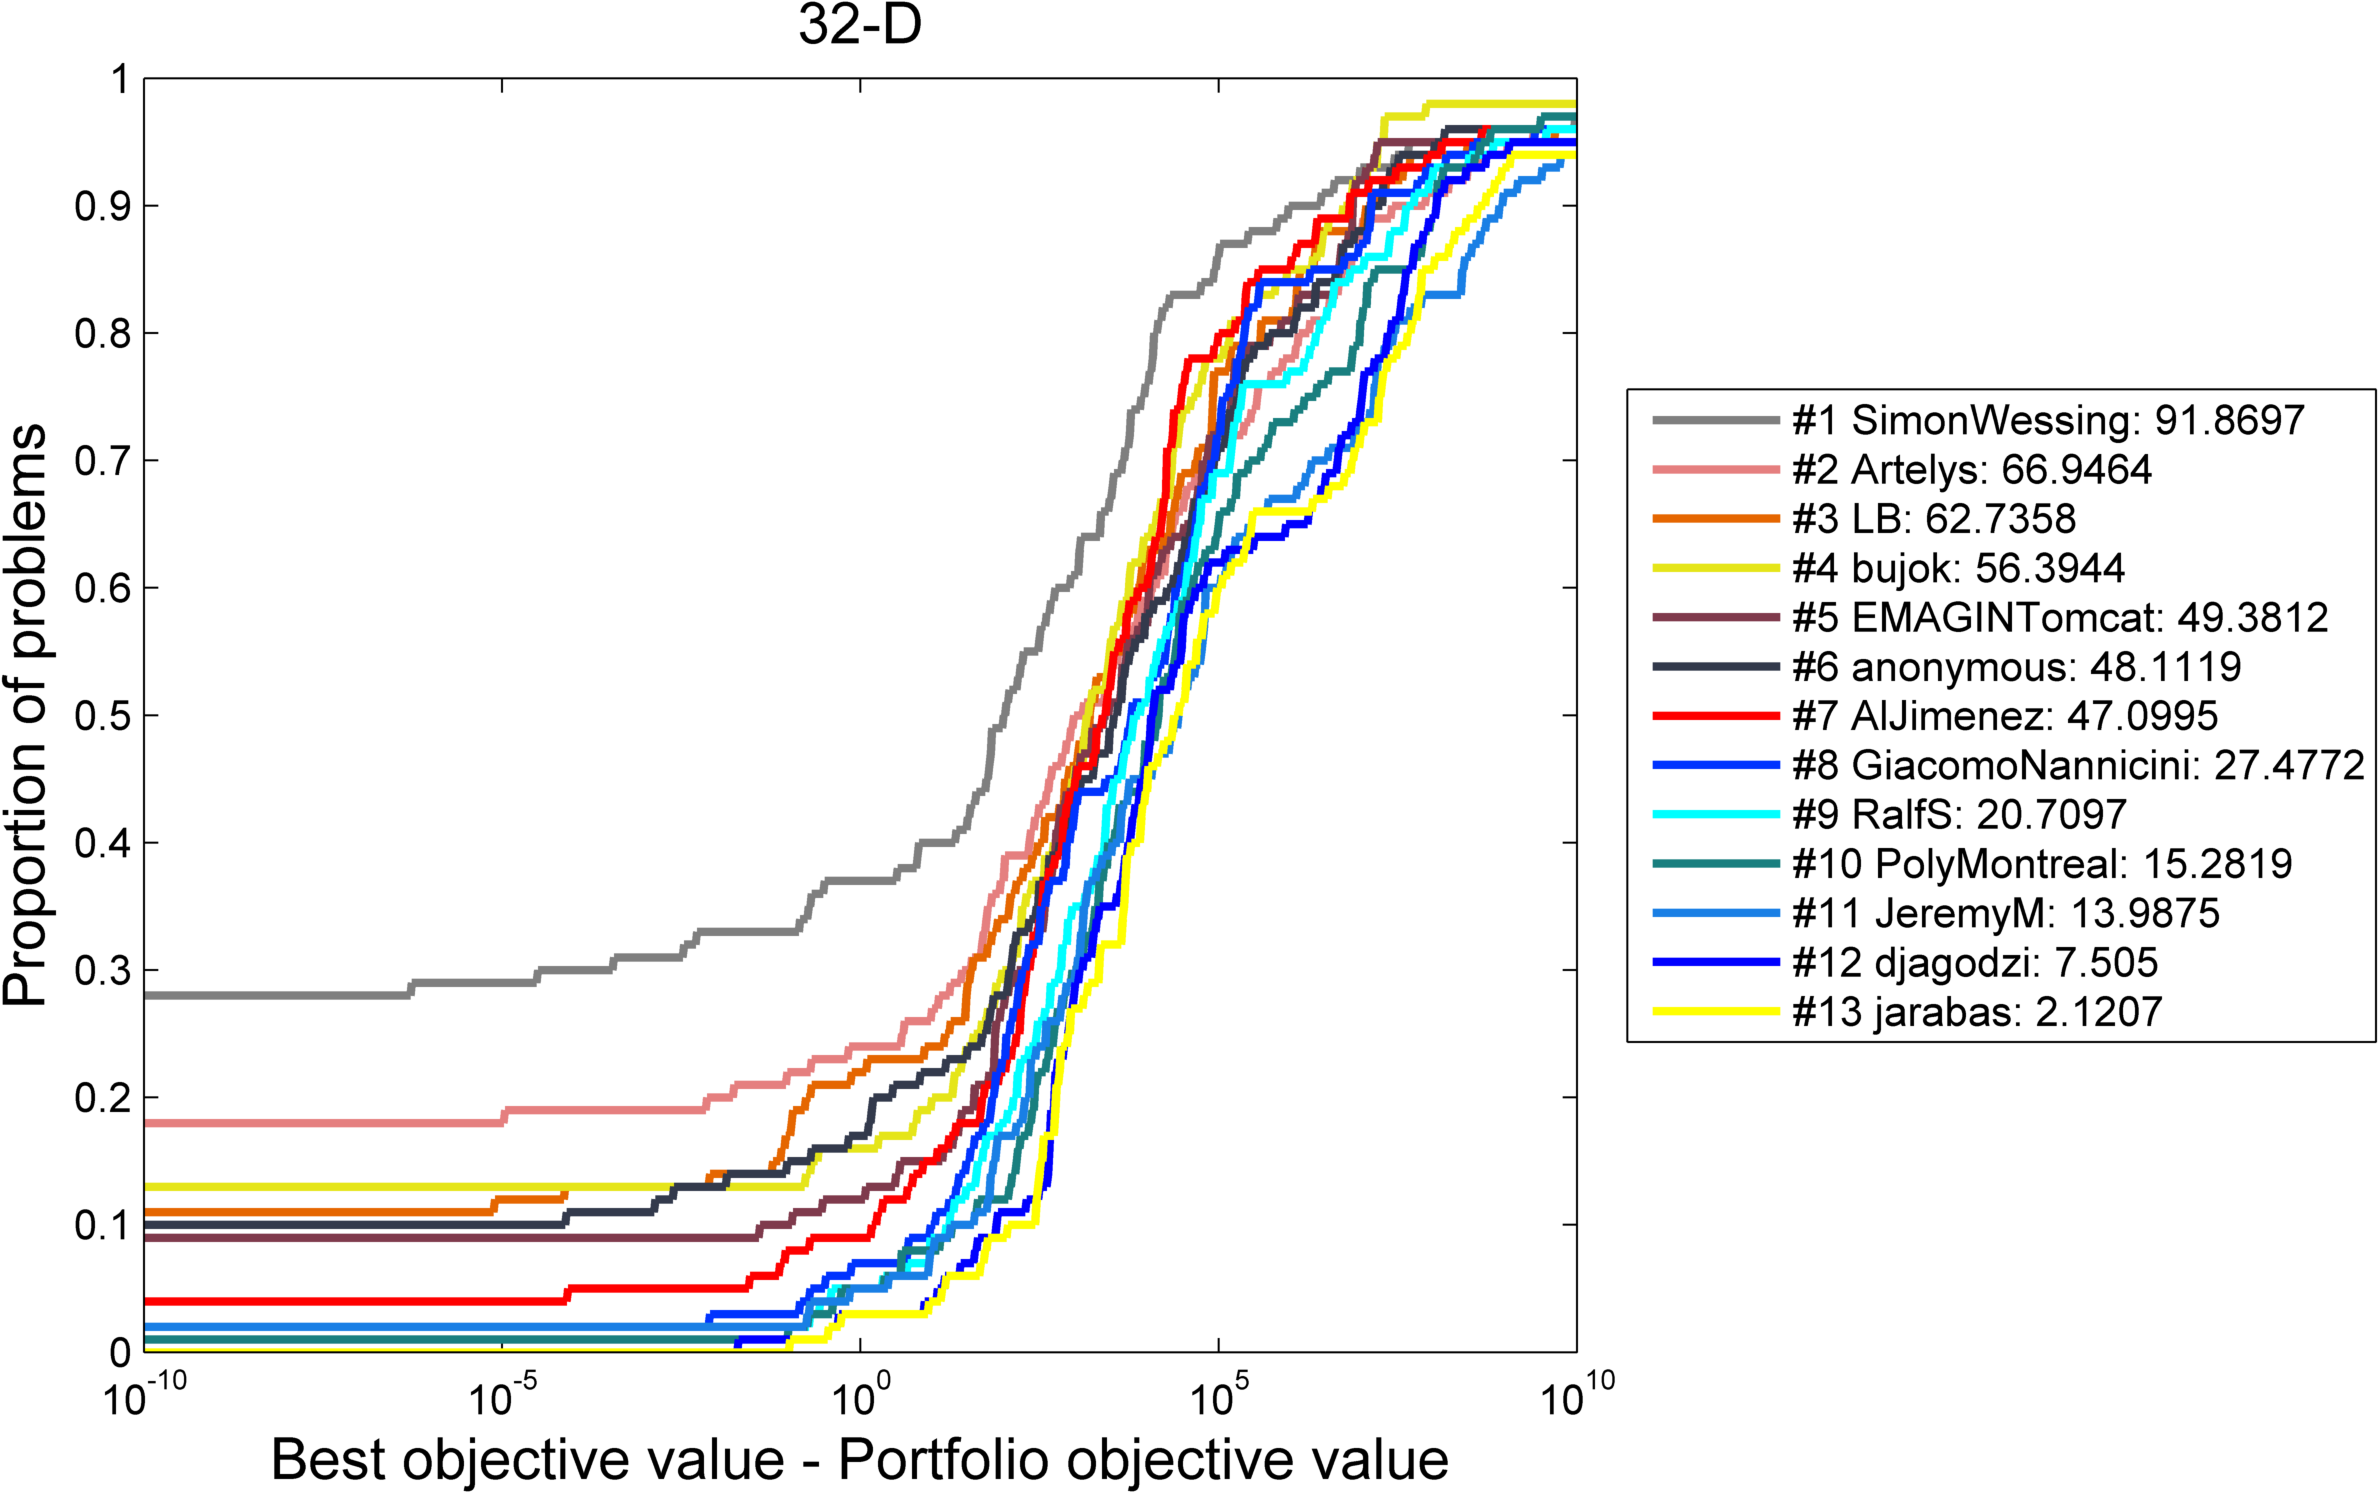
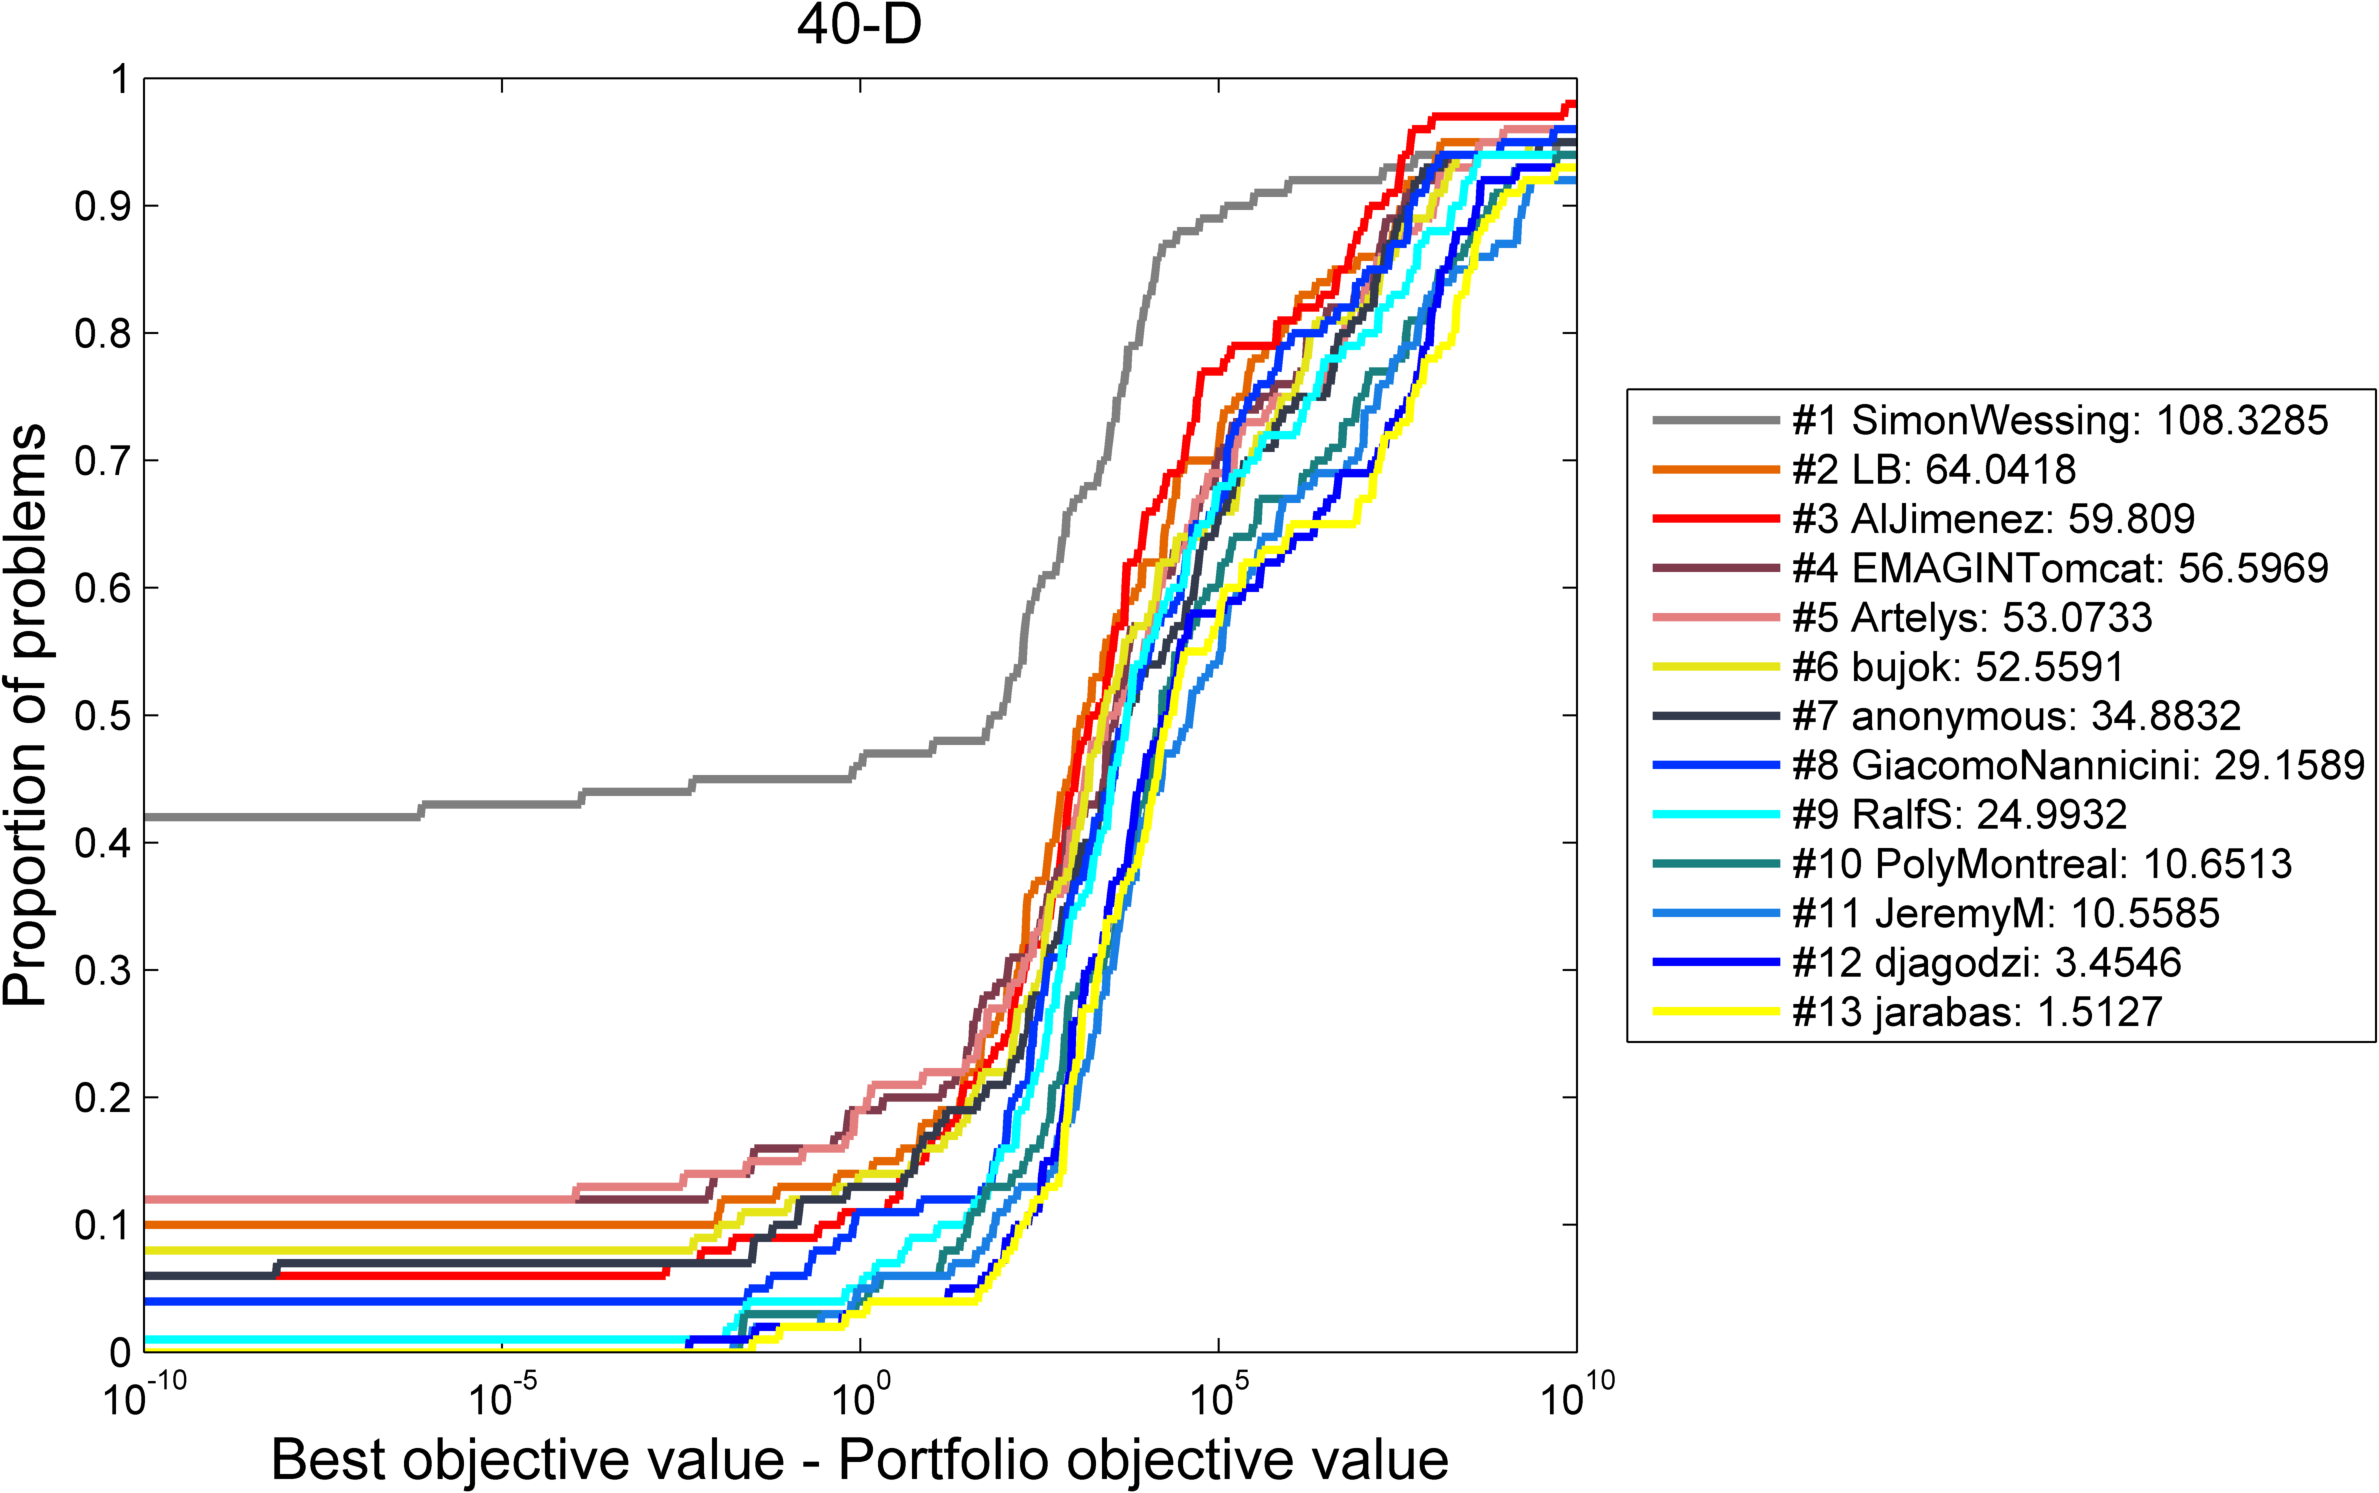
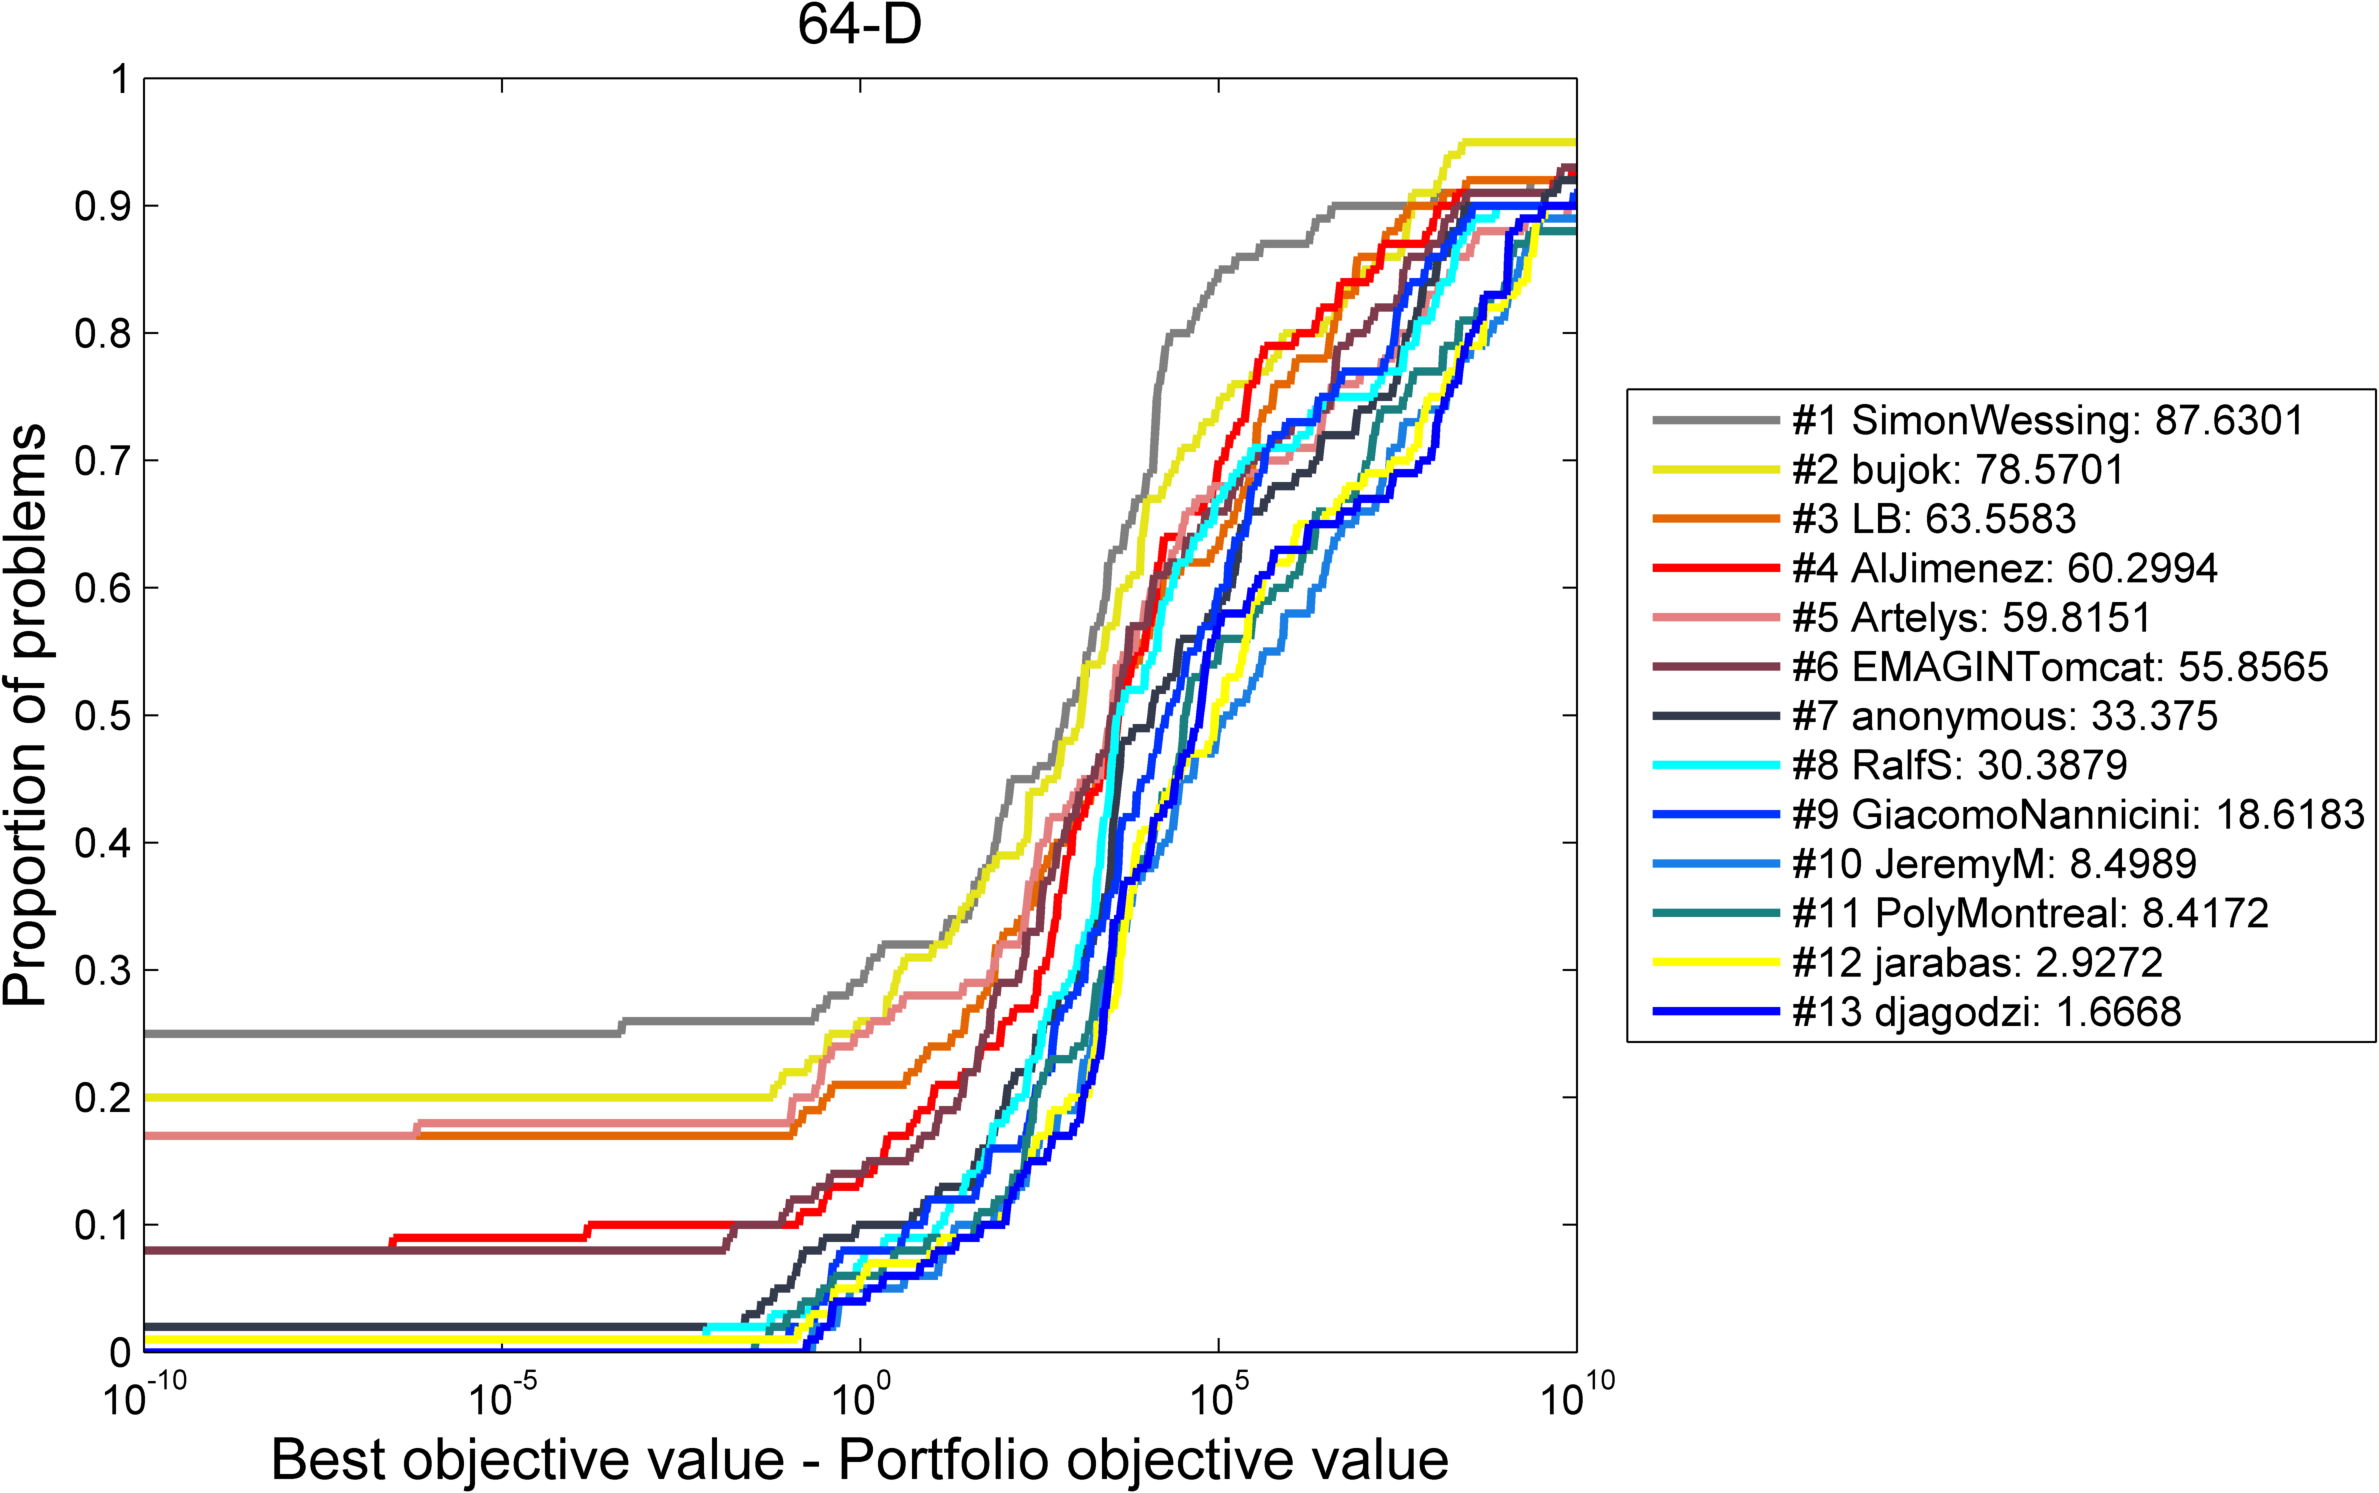
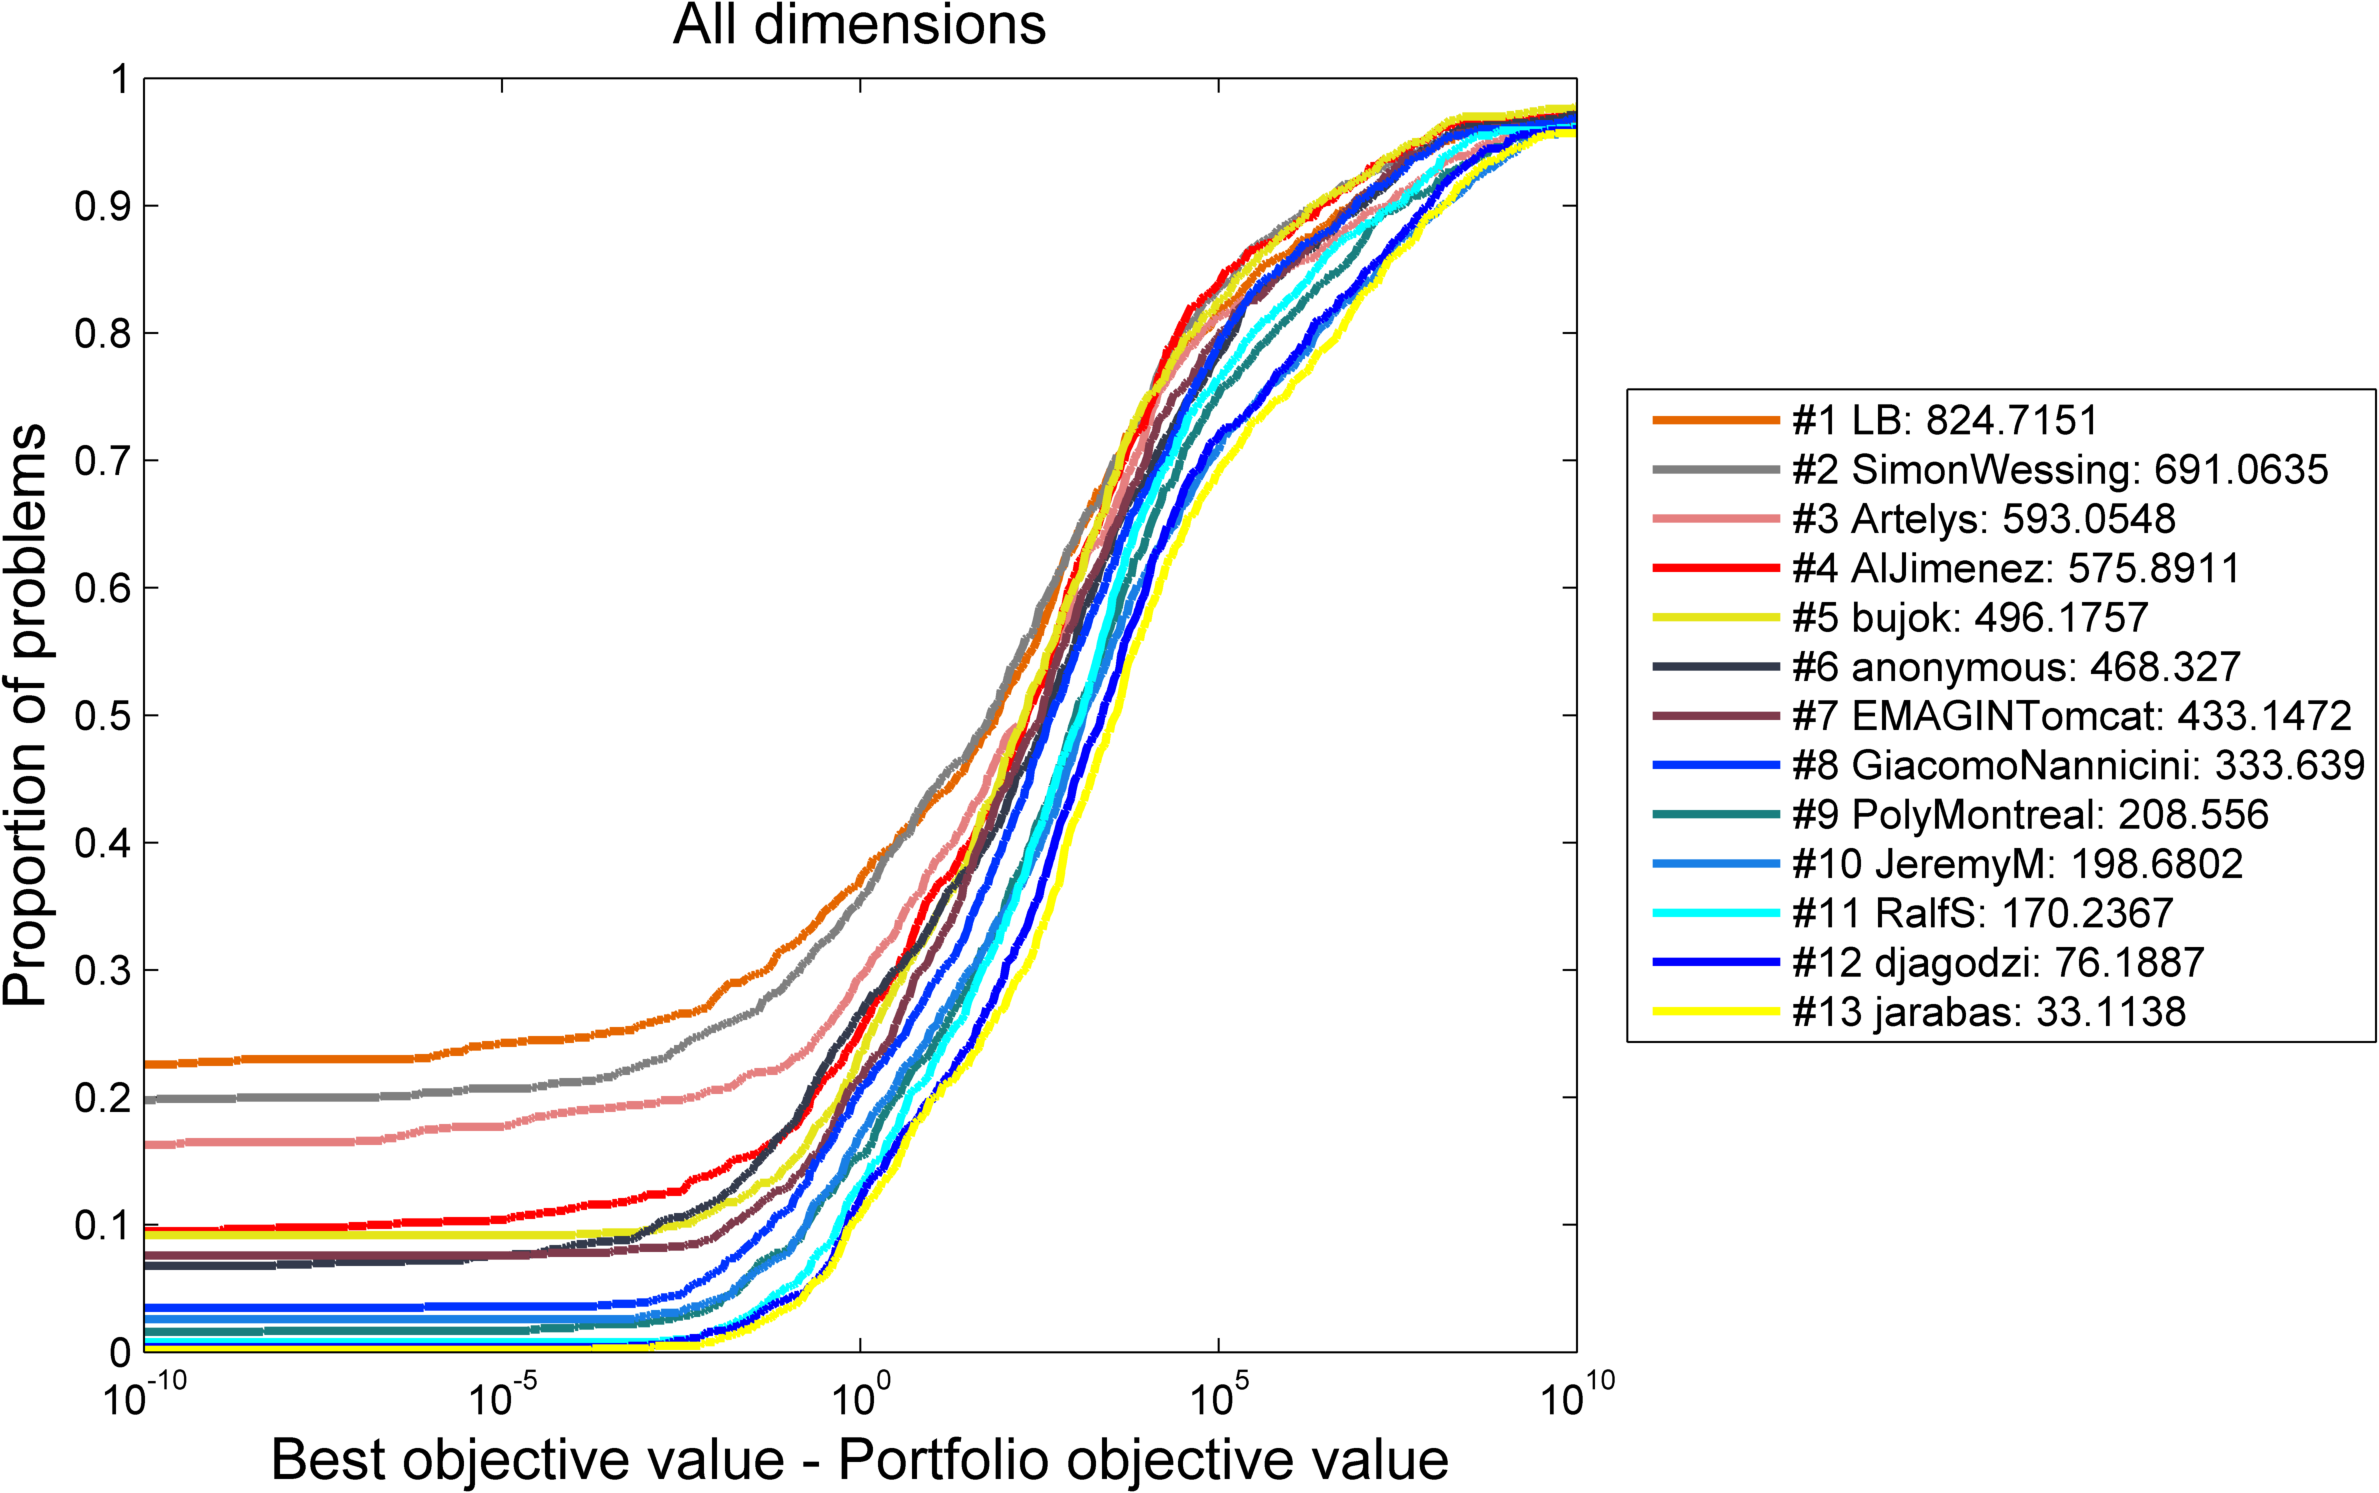
Visualization of Performance Data
The following figure shows an aggregated view on the performance data.
The following figures show the same data, but separately for each problem dimension.